A New Platform Maps US Police Violence Against Protesters
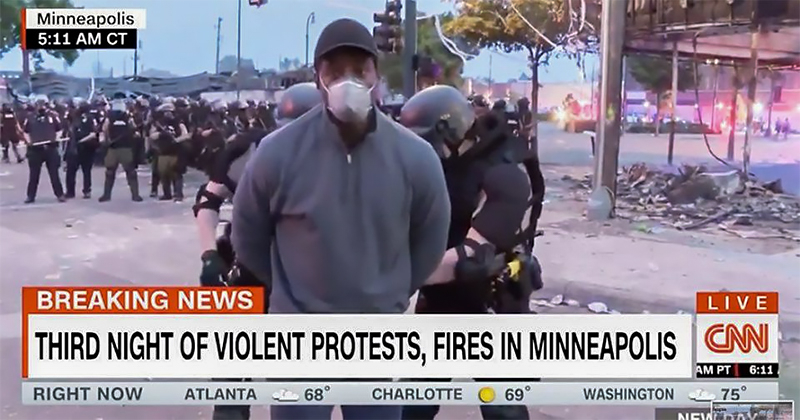
After the killing of George Floyd in Minneapolis on May 25, protests erupted across the United States. They have continued ever since, spreading out across the country as Americans come together to speak up against systemic racial discrimination and the militarization of the police. While the vast majority of protesters have shown up to speak their minds peacefully and engage in nonviolent resistance, the state has responded with disproportionate acts of aggression. As Bellingcat has previously reported, police have also used violence against journalists covering the protests.
Together with Forensic Architecture, Bellingcat has identified, verified, and archived over 1,000 incidents of police violence against protestors across the United States since May 2020. The data can be accessed here, and is available for use and visualization.
Bellingcat and Forensic Architecture have engaged in active outreach with organizations, activists, and journalists to ground our work in the context of the protests and assist ongoing cases with our data. Similarly, we have reflected on the ethical impact of publishing and locating these incidents alongside the historical and analytical importance of archiving them. In order to avoid amplifying imagery that has not been widely seen, we have limited our published dataset to media that already has at least 5,000 views. For more details, please view our mission statement.
The data has been visualized using TimeMap, a platform developed by Forensic Architecture that maps the incidents in space and time. We have categorized the data into different kinds of violence and misconduct: Physical (Assault, Arrest/Detention, “Less-lethal” rounds), Chemical (Tear gas, Pepper spray), Destruction/confiscation of property, Permissiveness to the far-right, Hiding identity, Attacks on legal observers, and Attacks on medics.
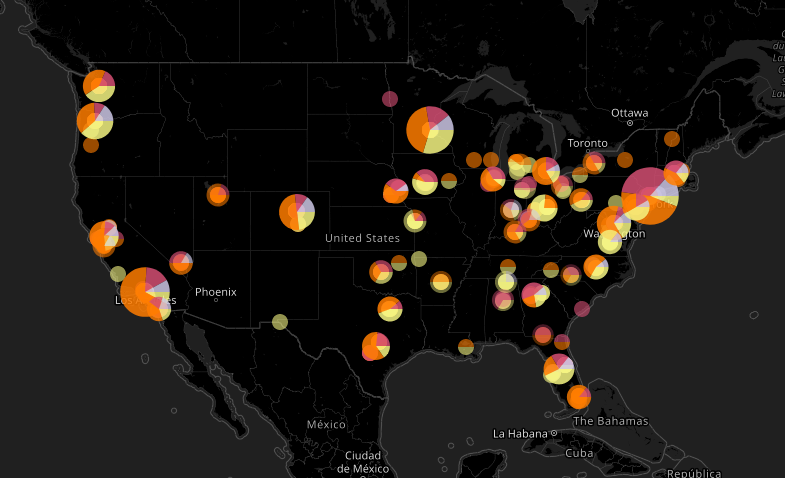
Data visualization by Forensic Architecture, 2020. Used with permission.
We have published the map and the dataset in order to allow anyone to investigate the data and find patterns. Our analysis has shown that this behavior is widespread and ongoing. Police officers across the entire country, from different towns and cities, have used violence and deliberate aggression against protesters. This is not a case of one bad police department, rather it seems that this behavior is intentional and part of the country-wide protocol.
This is also violence that is, in some cases, rare for many of these cities and departments. There were some cities that did not previously have protocol around chemical weapon usage, because before these protests chemical weapons had only been used in specific SWAT team situations. Nevertheless, their police forces still deployed tear gas on protestors. The response to the first wave of protests has normalized this violence, despite public outcry and resistance.
This norm has maintained itself and continues to spread throughout the country.
While many organizations are working hard to achieve justice and accountability for victims of the violence, their job is complicated due to the unique concept of qualified immunity in the United States. This is why we believe it to be vital that these acts are archived and visualized, to create a historical record of the violence at these protests and to shed light onto the officers involved.
You can watch the video explaining the platform and the context of the protests, as well as access the map here.