What Oil, Satellite Technology and Iraq can Tell us About Pollution
Translations:
Few countries have oil reserves as deep as Iraq.
The extractive industries bring jobs and tax revenues to a nation that has been hobbled by invasion, war and insurgency for close to two decades. Yet this economic activity comes at a cost.
Oil spills, pollution and declining air quality have taken a significant toll on the environment, and on the health of many Iraqis. On top of this, greenhouse gas emissions from the oil industry continue to contribute to global warming. Some areas of Iraq are even expected to become uninhabitable in the coming decades.
Yet assessing the true scale of the issue and exactly how pollution happens in Iraq is a demanding task. When applying for the Green Climate Fund in 2019 the Iraqi government, together with the UN Environment Program, outlined insufficient collection of environmental data as a challenge to implementing policies countering climate change. Precise information around the sources and impact of pollution on many Iraqi communities also remains sparse, despite the best efforts of local researchers.
However, as this article will show, open source methods can help.
We have selected two oil rich regions of Iraq, Basra in the south and Iraqi Kurdistan in the north of the country, to show how open source techniques can help gauge and discover pollution related to the oil industry.
The general methods outlined should be broadly transferrable to other countries and oil-producing regions. However, it must be noted that an array of stresses unique to Iraq, not least its tumultuous recent history, create a set of conditions that will seldom be replicated elsewhere.
Still, readers and researchers are encouraged to experiment with the tools and techniques detailed below.
These include:
- Using open-source data on flaring and remote sensing tools to build a better understanding of air pollution related to the oil industry
- Harnessing services such as Google Earth Engine alongside machine learning tools to track oil industry activities and impacts
- Mapping potential environmental hotspots using freely available satellite imagery and open-source data combined with mapping tools.
Among the findings of the case studies is evidence that pollution from oil refineries is drifting over a number of Iraqi towns and cities, while damaging oil spills and leaks appear common around oil pipelines and infrastructure.
What the data shows is how pollution in Iraq can be visualised as well as persistent issues with oil wastes and dumps in the vicinity of refineries.
Mapping the Scene
To begin with this type of research, it is first important to identify where oil infrastructure is located, the type of chemicals to look for and the areas that may be impacted by pollution.
Mapping services can help with the first part of this endeavour, as can historic reports.
For example, the below diagram from a 2008 US Congressional document helpfully details Iraq’s main pipelines and oil fields.
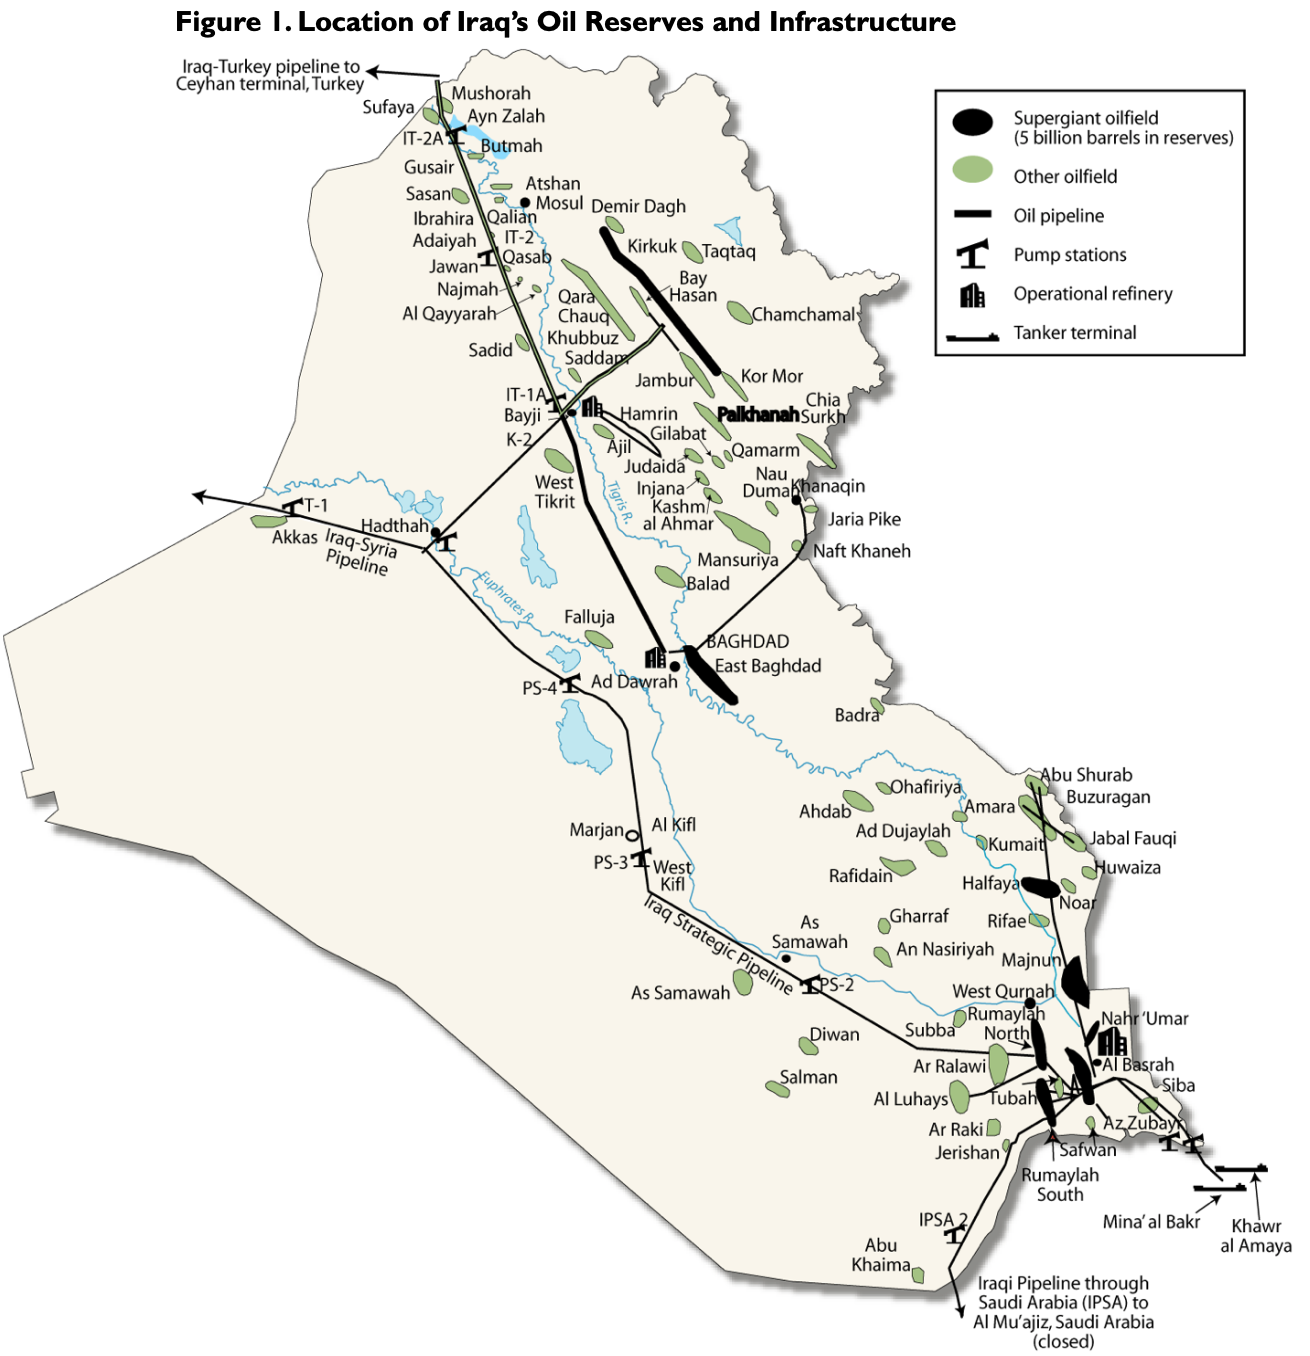
An image detailing oil infrastructure in Iraq taken from a 2008 US Congressional document.
We can use this document as a reference point to check out the facilities it details on publicly available mapping services for a more up-to-date picture.
Wikimapia is a particularly useful source in this regard as it allows users to search for locations relating to categories of industry. For the purposes of this exercise, we are looking for “oil and gas industry” facilities in Iraq.
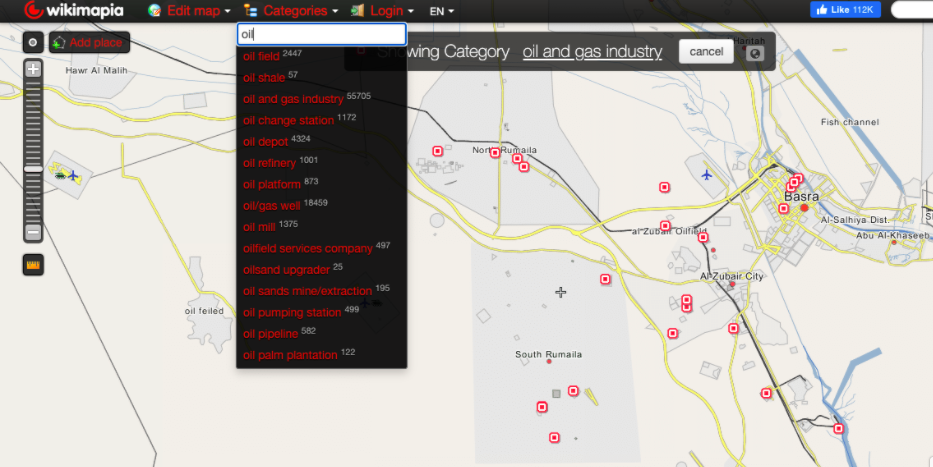
A screen grab showing oil and gas category search options in Wikimapia.
Once we search for this category over a prescribed area within Iraq, we are presented with a map containing points that detail known oil fields, facilities and other locations related to the oil and gas industry.
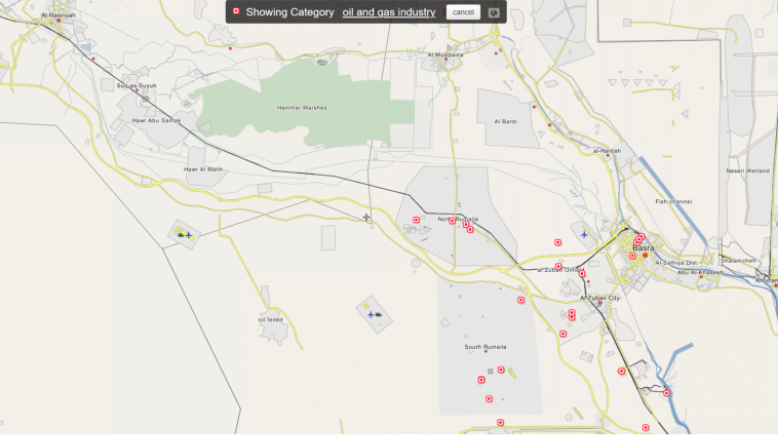
A screen grab from Wikimapia with points detailing known oil and gas industry locations
Another useful aspect of Wikimapia is that it allows users to choose a base layer map from prominent mapping services such as Google Maps and Bing.
Choosing the right base layer option for your project can be important as some mapping services offer more up to date coverage of specific regions. For example, Bing appears to have more recent imagery relating to Iraq than Google.
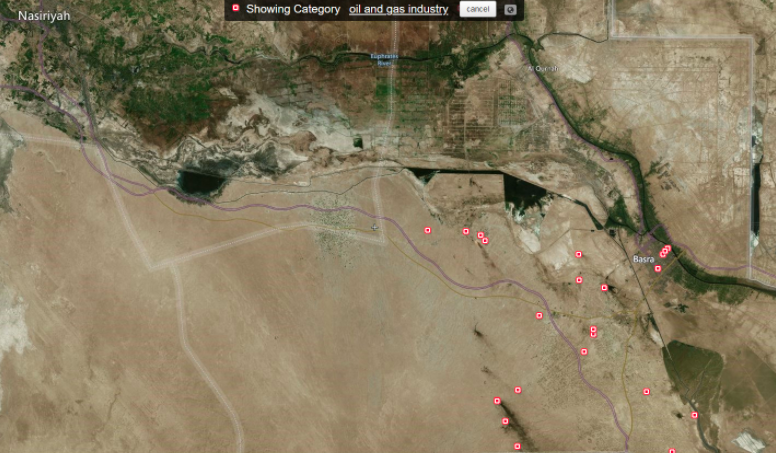
A screen grab from Wikimapia with points detailing known oil and gas industry locations in the Bing satellite map setting.
Other helpful mapping sources include Open Infrastructure Map and OpenStreetMap. The former, like Wikimapia, allows for sites in specific industries (such as oil and gas) to be detailed and searched for. In the image below, for example, a search for “oil and gas” facilities west of Basra details pipelines as well as a smattering of individual wells (represented by grey dots).
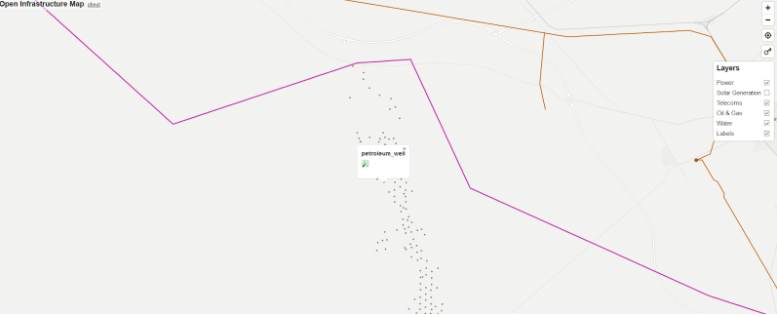
A screengrab from Open Infrastructure Map detailing the site of oil wells near Basra.
Further satellite imagery can be found via the likes of MapHub, another open source mapping tool, that allows users to mark their own sites of interest. This has been done in the image below where oil facilities outside Basra are noted and classified. MapHub also offers a range of base layer options, including from Apple Maps and ESRI, a popular provider of geographic information.
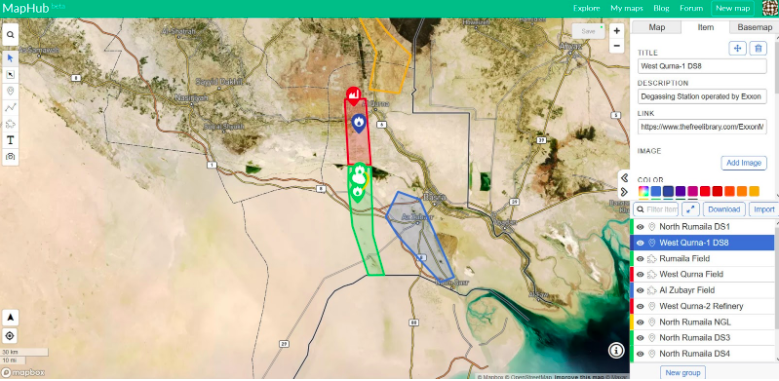
A screengrab from MapHub with points detailing oil facilities outside Basra.
These are a few of the main platforms that will allow us to identify and pick out sites of interest as well as to visualise them in helpful ways.
Next, however, we’ll need to familiarise ourselves with tools that allow us to monitor pollution. Some of these also use satellite and mapping technology, but others entail tapping into networks of publicly available sensory data.
By combining these monitoring tools with the mapping platforms detailed above, we will eventually be able to discover and visualise pollution in a way that can help us begin to understand its extent and impact.
Taking OSINT to the Air
A number of useful publicly available tools can enable researchers to gauge the likes of pollution and air quality at locations around the world.
While not all of those detailed below will be relevant to the question of pollution in Iraq, highlighting a few more than is immediately necessary to give an idea of what is possible remains a worthwhile exercise.
Air Quality Index
The Air Quality Index (AQI) uses a network of hundreds of ground-based sensors to measure the levels of five major pollutants (sulphur dioxide, nitrogen dioxide, PM2.5, ozone and carbon monoxide) at various locations around the world. The table below provides a description of the sources and health effects associated with three of these pollutants that are particularly relevant to Iraq.
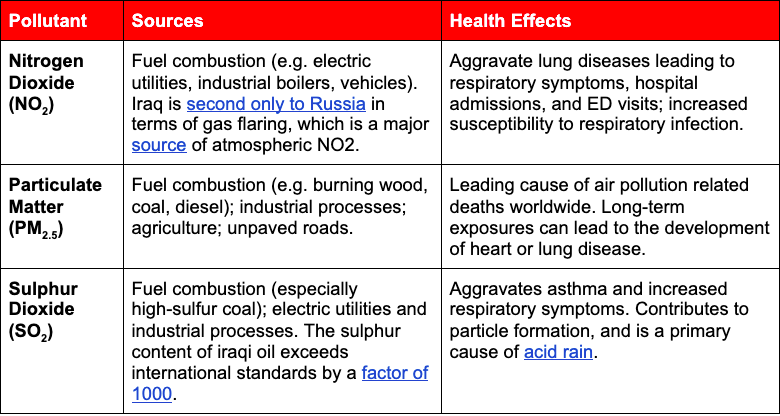
A table detailing the sources and health effects of NO2, PM2.5 and SO2 as described by the US Environmental Protection Agency.
While a useful tool in many cities, there is only one AQI monitoring station in Iraq (situated in the US embassy in Baghdad). While that means it won’t be possible to use AQI data to get a wide picture of pollution in the country, this station can still reveal some interesting, if localised, detail.
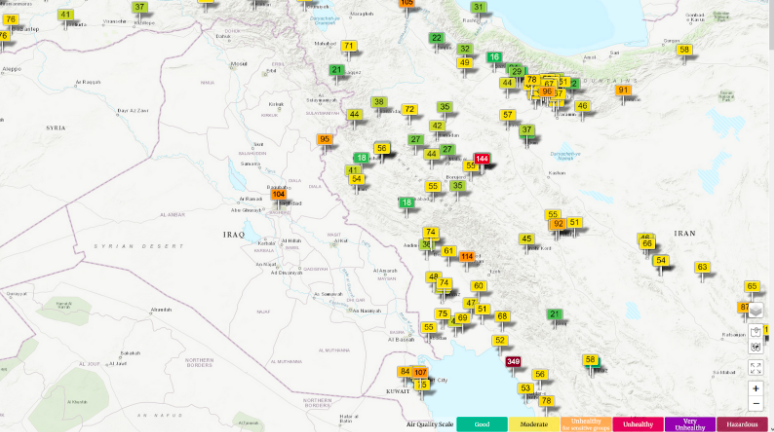
A screen grab of a map detailing the one AQI monitoring station in Iraq. As can be seen, neighboring Iran has dozens more.
Below is a comparison of average daily AQI values for particulate matter (PM2.5) between San Francisco and Baghdad that was downloaded to create the following graph.
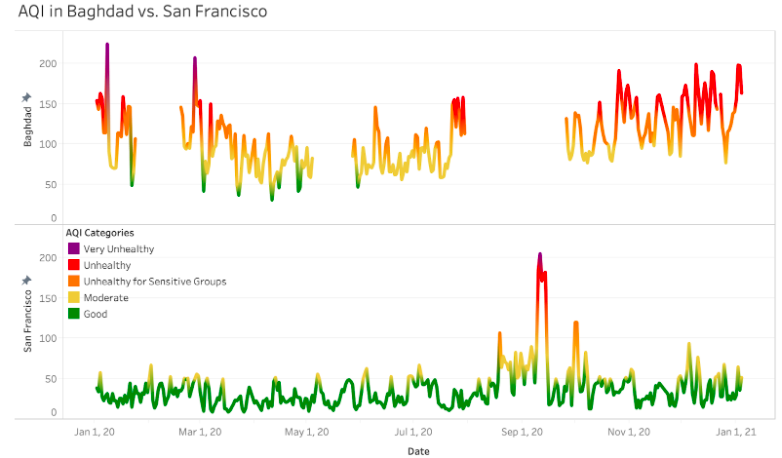
A chart comparing AQI readings between Baghdad and San Francisco.
The spike in AQI that San Francisco experiences in September 2020 reflects the effect of the worst wildfire season in California’s history on air pollution. For much of the year, the level of PM2.5 pollution in Baghdad is comparable to the air quality in California during the peak of wildfire season.
Baghdad’s poor air quality is a legacy of conflict. Because Iraq’s energy infrastructure has been decimated by successive wars, private diesel generators make up around 30% of Iraq’s electricity supply. These generators produce up to 60 times more air pollution than gas plants per one megawatt produced. In cities such as Baghdad, one study found a single neighbourhood can have over 600 diesel generator units.
Although the global network of AQI monitoring stations provides a standardised and intuitive way of assessing air quality, there are significant gaps in coverage (as emphasised by there being just one AQI station in Iraq). These ground-based stations are typically operated by local environmental protection agencies, and only measure air quality in the direct vicinity of the sensor. Many countries simply do not publish AQI data.
CAMS
The Copernicus Atmosphere Monitoring Service (CAMS) solves some of these issues by providing open-source meteorological data that includes satellite-derived measurements of a wide array of pollutants, including all constituents of the AQI.
The high temporal resolution and global coverage of CAMS data makes it an invaluable tool for the monitoring of both routine pollution and environmental terrorism. For example, on 20 October, 2016, retreating ISIS militants set fire to a sulphur processing facility in Al-Mishraq. The resulting plume of sulphur dioxide rivalled that of a volcanic eruption, killing two civilians and hospitalising at least 1,000 more, according to reports. The timelapse below (created using the QGIS open source geographic information system) visualises global SO2 levels for the month of October 2016 from the CAMS archive:
A visualisation of sulphur dioxide levels for October 2016 using CAMS. Data for this visualisation can be found here by selecting the relevant time and pollutant parameters.
Until mid-october, the highest levels of sulphur dioxide can be found where one might expect them to be: industrial areas in China and India, volcanoes in Southeast Asia, and busy port cities. When Al-Mishraq is set on fire, a massive plume of SO2 is released. At its peak, the cloud of sulphur dioxide stretches from Kenya to the Arctic circle, and from Algeria to Japan.
VIIRS
Because many significant sources of air pollution also emit light, images of the earth taken at night can help track pollution. Night-time images from NASA’s Visible Infrared Imaging Radiometer Suite (VIIRS) allow for the quick identification of major sources of air pollution including urban areas, highways, wildfires, and gas flaring – a particularly harmful practice where gas bubbles present in oil are burned off and released via a flame that rises above oil platforms, emitting a number of pollutants in the process.
The timelapse of VIIRS imagery below spans five years (2013-2018) in one-month increments, focusing on Northern Iraq. This time period was chosen to highlight the fall and recapture of Mosul — as is depicted by the darkening of lights around the city between 2014 and 2017 — but VIIRS data are available up to the present day. Beyond highlighting light from cities, villages, and roads, VIIRS imagery makes the spatial distribution of oil infrastructure immediately clear. The rows of bright spots stretching south from Erbil are methane flares located along the supergiant Kirkuk Oilfield (shown above in the map of Iraq’s oil infrastructure).
Night time lights over Iraq between 2013 and 2017. Data and source code visible in Google Earth Engine. Source code also visible in GitHub. Visualisation by Ollie Ballinger
Google Earth Engine has been used to aggregate satellite imagery from a range of sources including VIIRs and links to the code used to produce the figures and visualisation above and those that follow are provided throughout (note, readers may have to sign in to Google Earth Engine to be able to see the code and figures).
VIIRS data is instrumental in the tracking of air pollution. The SkyTruth Flaring Map uses VIIRS to estimate the volume of gas flared by wells around the world based on their individual heat signatures. The Islamic State’s burning of the Qayyarah oil fields in 2018, another massive source of air pollution, is also visible in the timelapse above.
Sentinel-5P
Though VIIRS enables the identification of sources of air pollution such as flaring or oil fires, it doesn’t directly measure the scale of emissions. For that, we can turn to the European Space Agency’s Sentinel-5P (S5-P) satellite, which collects data on a range of pollutants including nitrogen dioxide, sulphur dioxide, and carbon monoxide.
Sentinel-5P measures the amount of pollution found in a vertical column between the ground and the cruising altitude of most planes. Though they are highly correlated, this doesn’t directly reflect pollution in the air we breathe (surface pollution), because plumes of smoke can be carried high up. However, S5-P provides some of the highest resolution measurements of airborne pollutants available to the public and has a one-day revisit time, enabling the tracking of emissions from individual oil wells, power plants, or factories. The only catch is that it’s a relatively new satellite, with imagery only available from mid 2018 onwards.
By using Sentinel-5P in conjunction with night-time lights imagery, we can pinpoint sources of air pollution. We can even get an idea of the number of people exposed to pollution by observing the overlap between NO2 clouds and urban areas. The timelapse below shows weekly Nitrogen Dioxide levels across Iraq in 2020, overlaid over night-time lights.
A visualisation of NO2 levels in Iraq and their rough source over the course of 2020. Data and source code visible in Google Earth Engine. Source code also visible in GitHub. Visualisation by Ollie Ballinger.
There are three main areas in which significant concentrations of NO2 are observed: Iraqi Kurdistan in the north, Basra in the south and Baghdad in the centre of the country. Smaller concentrations can also be seen in Najaf, just south of Baghdad. NO2 levels drop temporarily following COVID-19 lockdowns in March 2020, but promptly recover.
Case Study: Iraqi Kurdistan
Bringing together some of the techniques described above, let’s now try to see what we can discover about pollution relating to oil production in Iraq.
Using AQI data we have already been able to establish that values for particulate matter (PM2.5) in Baghdad are regularly as high as they were in San Francisco during the worst recorded wildfire season in California’s history. But what about other Iraqi regions where AQI data is not available?
In Iraqi Kurdistan, a resource-rich region in the north of the country, with an estimated 45 billion barrels of oil and 25 trillion cubic feet (tcf) of proven gas reserves, we have a handy head start. A very helpful map on the regional government’s website details sites where the main refineries, power stations and pipelines are located and who controls them.
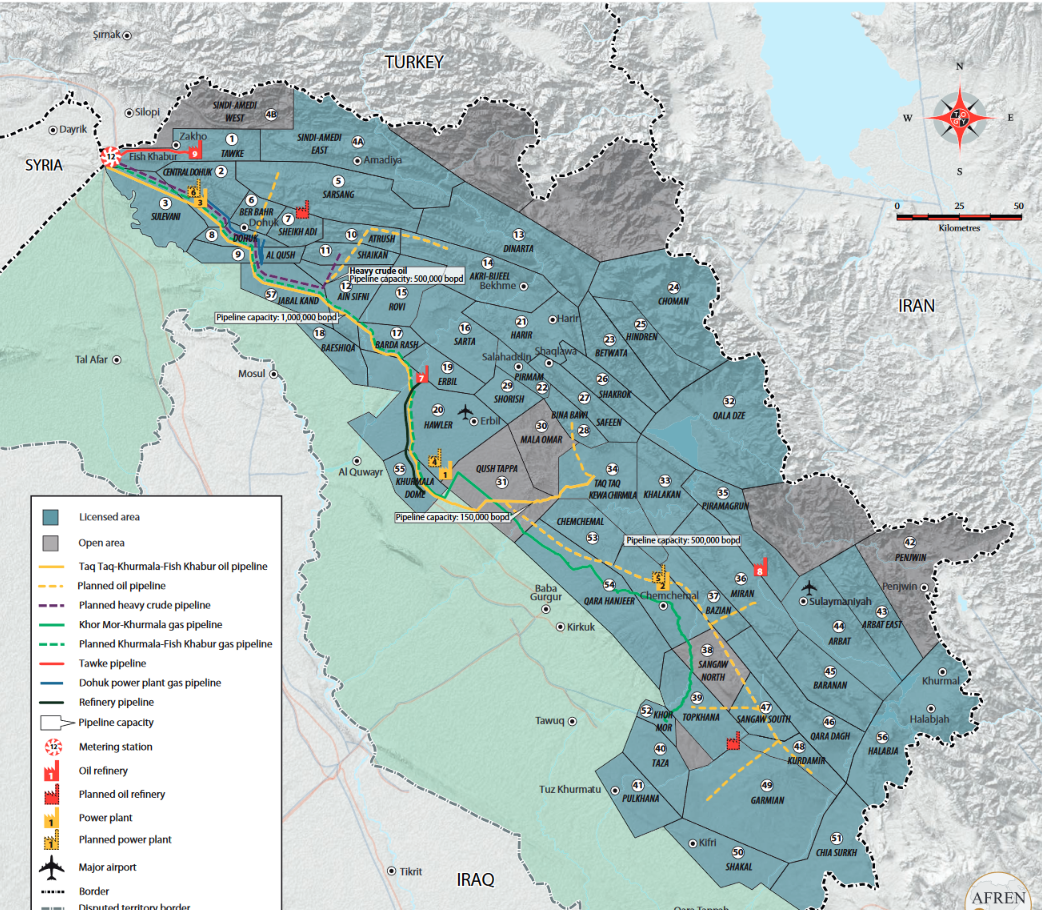
A map from the KRG Ministry of Natural resources showing the main oil infrastructure in Iraqi Kurdistan.
This narrows down our search and allows us to quickly focus on specific areas.
SkyTruth, and its pinpointing of oil and gas flaring sites, is another source of useful information.
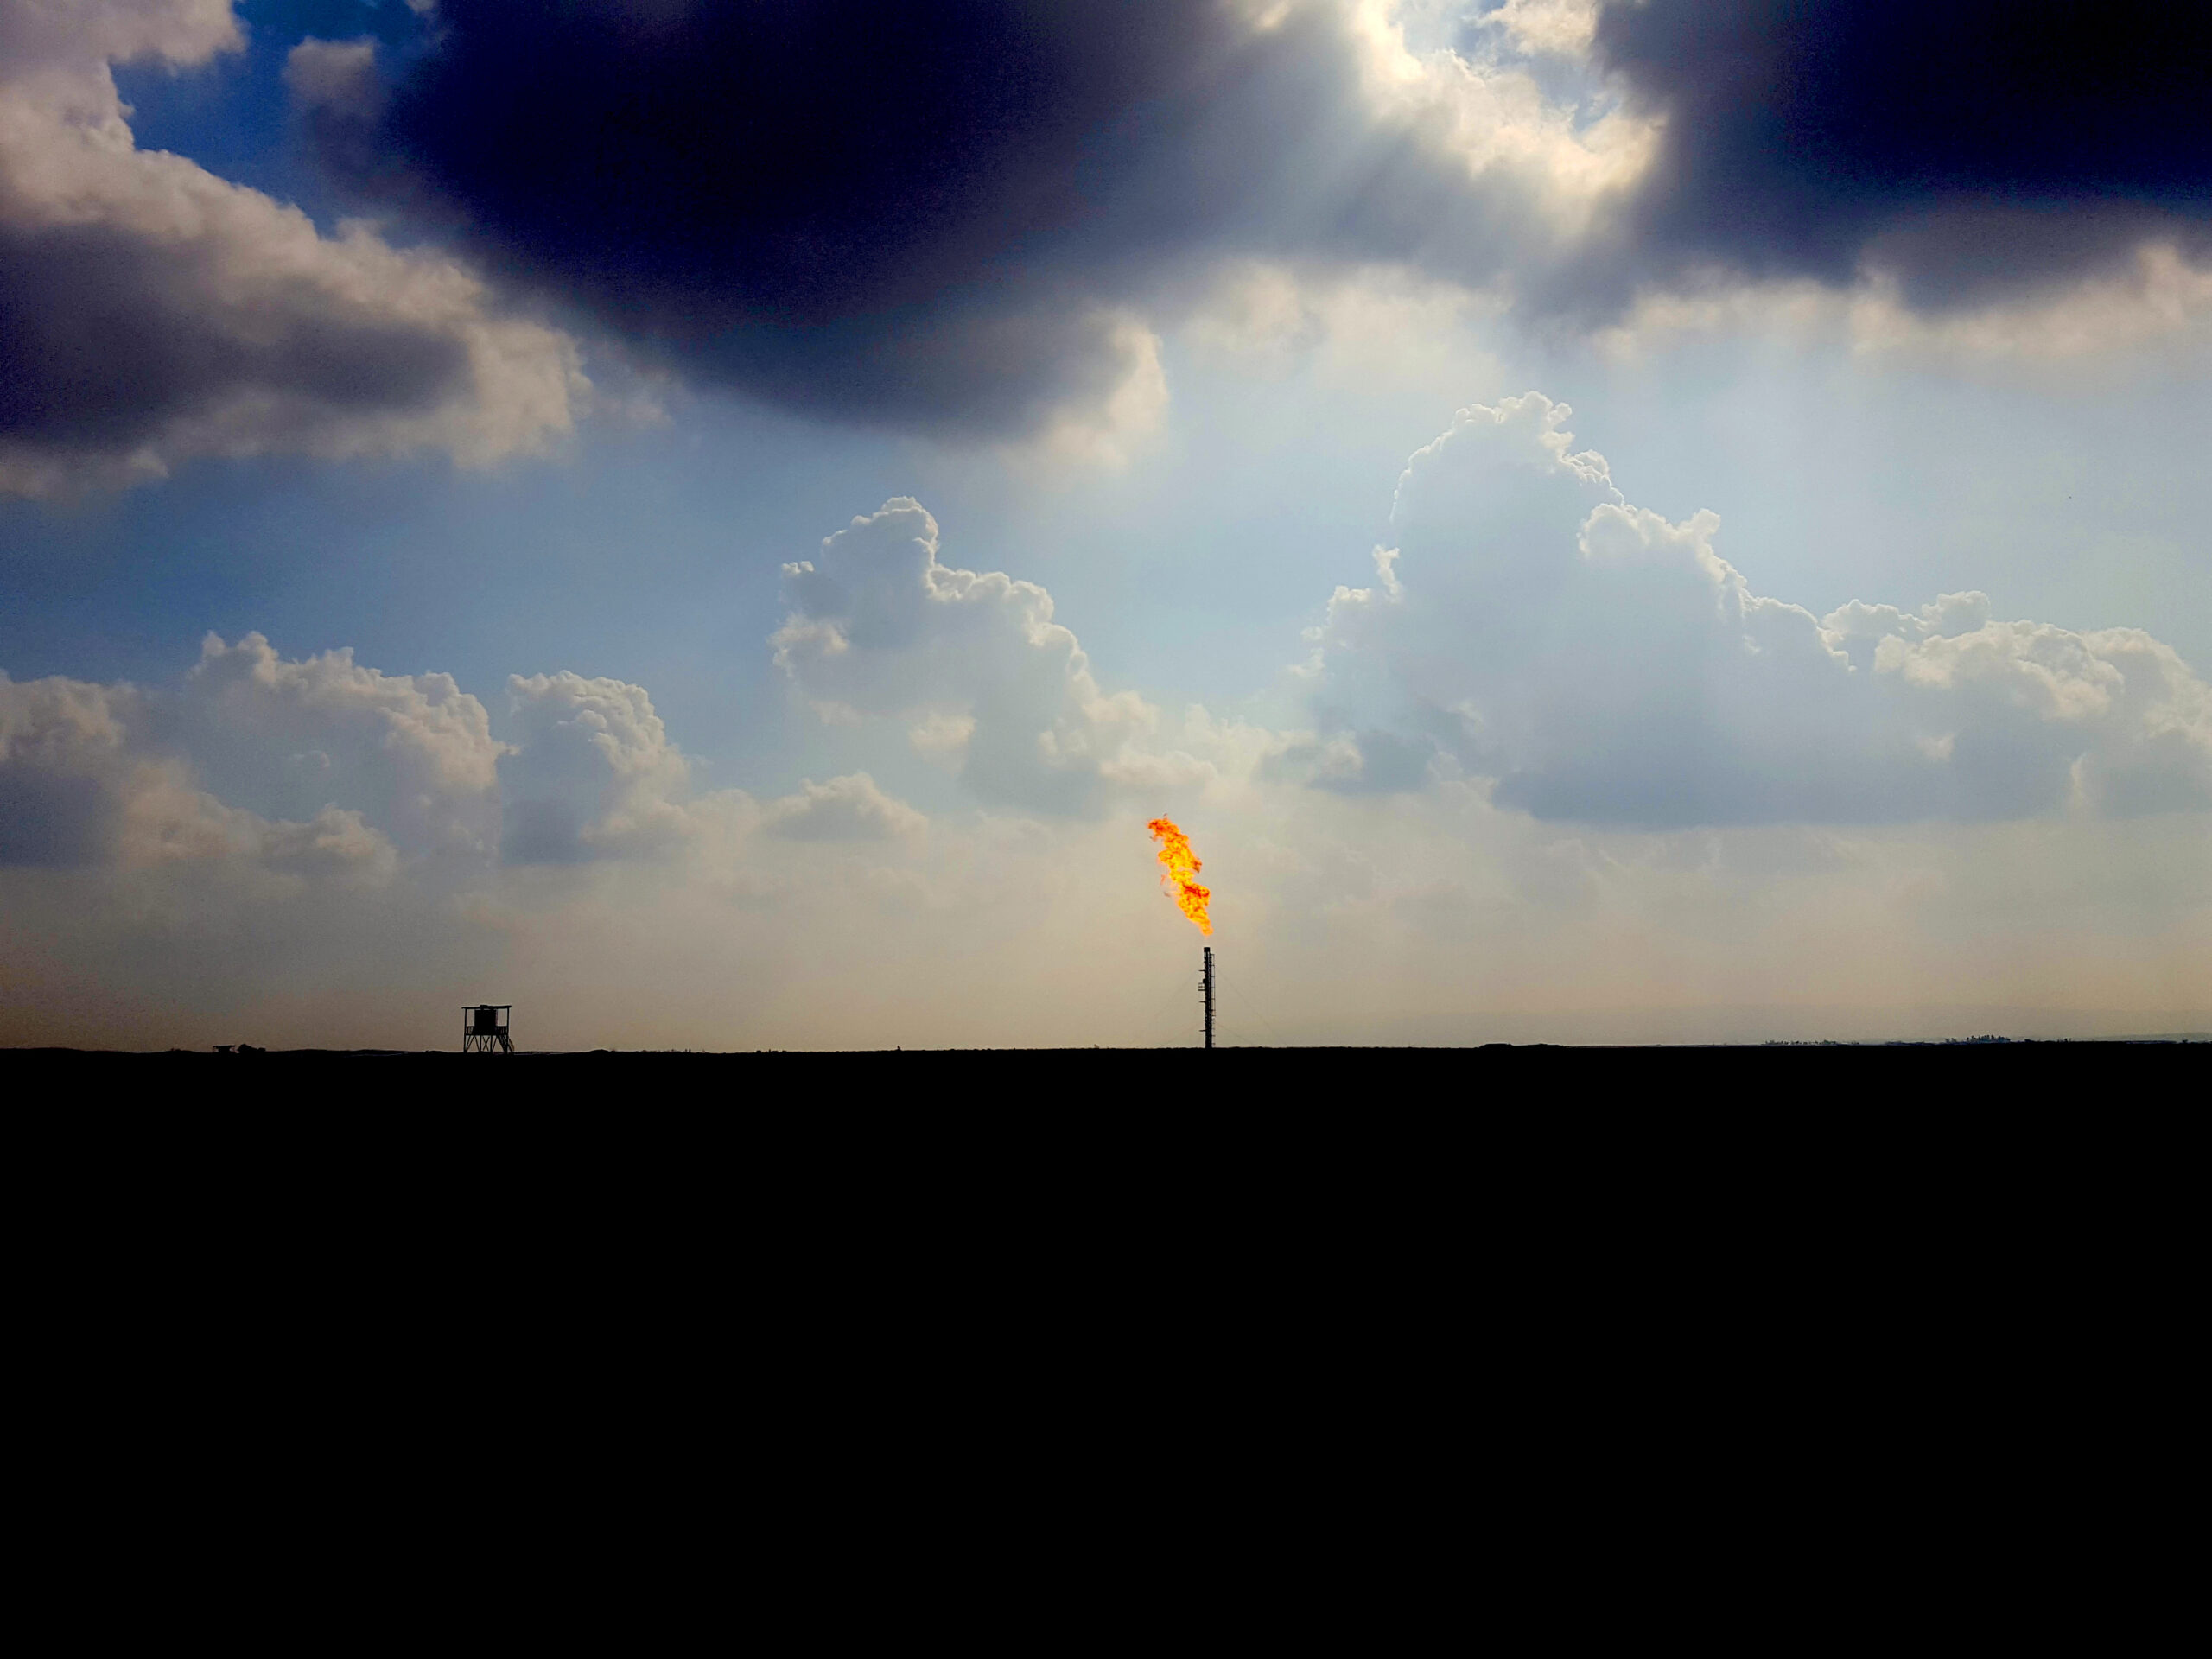
A flaring site is pictured at an oil refinery south of Erbil in Iraqi Kurdistan (Picture: Wim Zwijnenburg)
A single flare can release over 100 tons of SO2 per day, emphasising the extent of the pollution such practices can cause. For context, this is equivalent to roughly 20% of the daily sulphur dioxide produced by the United Kingdom.
The sulphur content of the oil from the Kurdistan region is also particularly high.
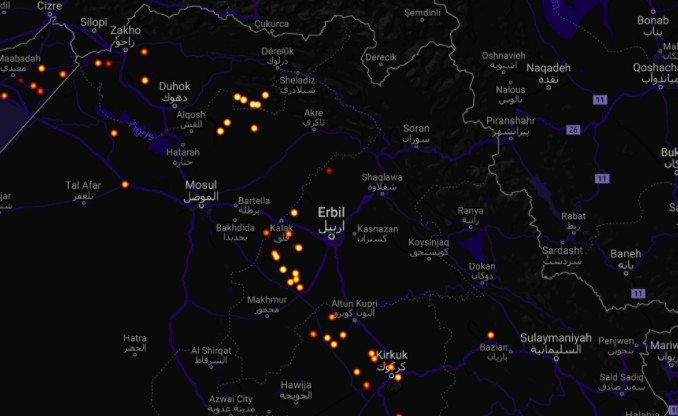
A screen grab of flaring sites located by SkyTruth in Iraqi Kurdistan
SkyTruth also provides users with an Annual Flaring Volume Estimates interactive map, with data available for the period between 2012 and 2021. We can thus select the area we want to assess (as done in the image above which details all of Iraqi Kurdistan).
This shows there were 190 sources of flaring during this time period with over 19.5 billion cubic meters of gas flared.
It is important to note, however, that SkyTruth data can contain double or triple points for some locations given a quirk of the data gathering process. The true total is likely less than 190 but the total of 19.5 billion cubic meters of gas flared remains consistent given SkyTruth still detects the same amount of heat released irrespective of its location.
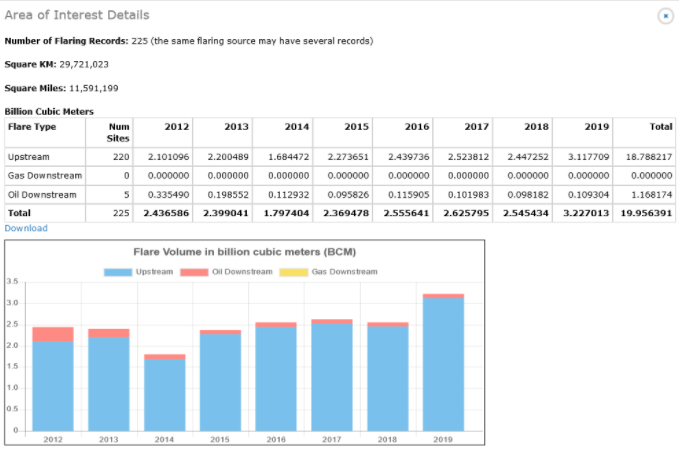
Flaring volumes in Iraqi Kurdistan between 2012 and 2019 as captured by SkyTruth.
While the latest full-year SkyTruth figures are dated to 2019, new flaring sites continue to be noted in Iraqi Kurdistan, as noted in this Twitter thread.
Oil exploration is increasing in Iraqi #Kurdistan over the last few years, with growing concerns over its environment and health impacts. Here's a 2016 build facility flaring oil from the UAE-based TAQA oil company, at the Atrush oil block eat of Dohuk https://t.co/FOtQuy8uVy pic.twitter.com/BLXb3JZewf
— Wim Zwijnenburg (@wammezz) January 17, 2021
But how does flaring and the pollutants it creates impact Iraqi Kurdistan?
We can look to answer this question by combining VIIRS imagery with Sentinel-5p data on NO2 produced around the sites that SkyTruth and various mapping services and resources have helped us identify.
NO2 is visualised spreading over parts of northern Iraq. Data and source code visible via Google Earth Engine. Source code visible in GitHub. Visualisation by Ollie Ballinger.
The video above shows plumes of nitrogen dioxide (NO2) emanating from the row of bright flares between Erbil and Kirkuk. As wind directions change, we can see the areas impacted for the month of October 2020.
Significant amounts of NO2 appear to drift towards the cities of Mosul, Erbil and Kiruk.
Despite changing wind directions, plumes of NO2 appear to consistently originate around the Khurmala Refinery south of Erbil. Bellingcat reached out to the operators of the refinery to ask about this by email but did not receive a response before publication.
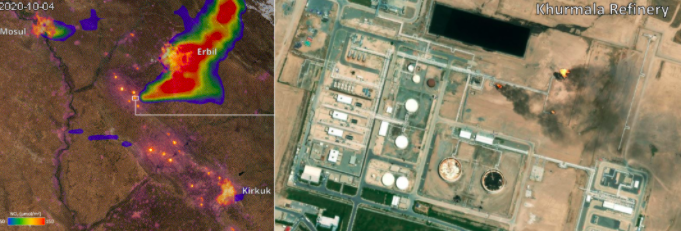
A flaring plume of NO2 can be seen at the Khurmala oil refinery with Sentinel-5p satellite and high-resolution imagery via Zoom.Earth
A quick scan of the area around Kirkuk using data from Skytruth and Wikimapia shows there are at least 15 oil flaring points surrounding the city of 800,000 people.
One particular flaring location appears to be situated next to a residential area in the north east of Kirkuk. It can be geolocated here from this video posted on social media posted by a Kurdish-Dutch activist who visited the site in late December 2020.
Look at these children of #kirkuk they have made a playground out of broken oil pipelines and show off their athletic skills. Please give fascinating Kirkuk dating back to 5000 years ago a future. Let’s build libraries, playgrounds, museums, galleries and schools.. pic.twitter.com/sJVbpabmjm
— Dashni Morad (@Dashni_Morad) December 14, 2020
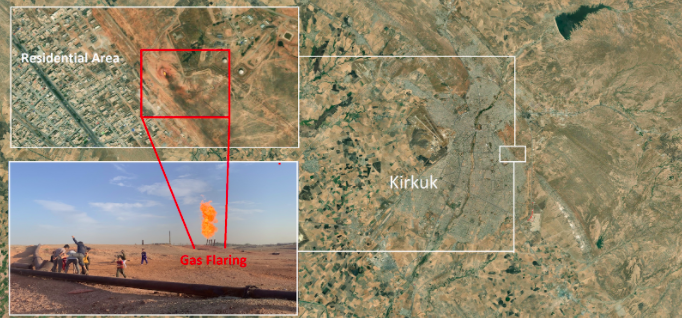
Children playing a gas flaring pipe, November 2020. Photo by Dashni Morad. Map via Zoom.Earth.
Other satellite monitoring tools that can help locate flaring sites include NASA’s Fire Information for Resource Management System (FIRMS). This is a platform that enlists VIIRS and MODIS /Aqua/ Terra satellite sensors to pick up heat signatures (including those given off by flares).
The red squares in the image below show what could be fires or flares detected by FIRMS in the Kashe industrial district in north west Dohuk.
We can further analyse this area by employing the Sinergise’s Sentinel Hub platform, using satellite imagery from the European Space Agency’s Sentinel systems.
To detect fires, we need to use Sentinel Hub’s False Color (urban) band setting. This particular setting uses a near-infrared band as part of its composition that picks up heat signatures.
In the (below) Sentinel-2 image from March 17, 2021, we can see what appear to be flares populating the same rough locations as pinpointed by the FIRMS data.
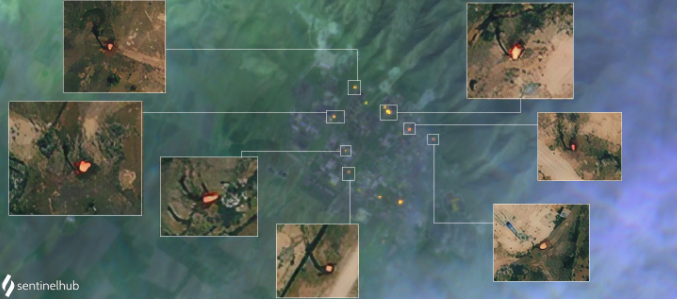
Kashe Industrial district seen with Sentinel-2 False Colour band and MAXAR high-res images showing flares
We choose to use this image, which was taken on a day when the area was partially covered by cloud, as an image taken on a clear day rendered similar coloured objects that turned out to be rooftops. The near-infrared heat signature, however, is visible through light clouds while the colour of the roofs are obscured.
The photos embossed over the Sentinel Hub image above were taken from Zoom.Earth on 14 August 2018. This obviously shows that flaring has been carried out at these locations for a number of years.
Flaring, of course, is far from the only source of pollution in Iraq and Iraqi Kurdistan.
Attacks on oil installations by Islamic State have resulted in oil wells being burned.
The bombed oil wells east of Kirkuk are still burning today, as black smokes clouds the skies, moving over Kirkuk city.
Satellite imagery by @planetlabs and @ESA_EO via @sentinel_hub. https://t.co/UH4l1oyGWf pic.twitter.com/3ITHIumOLO
— Wim Zwijnenburg (@wammezz) December 12, 2020
Oil spillages have also been documented around many small refineries at industrial locations causing local hotspots of pollution.
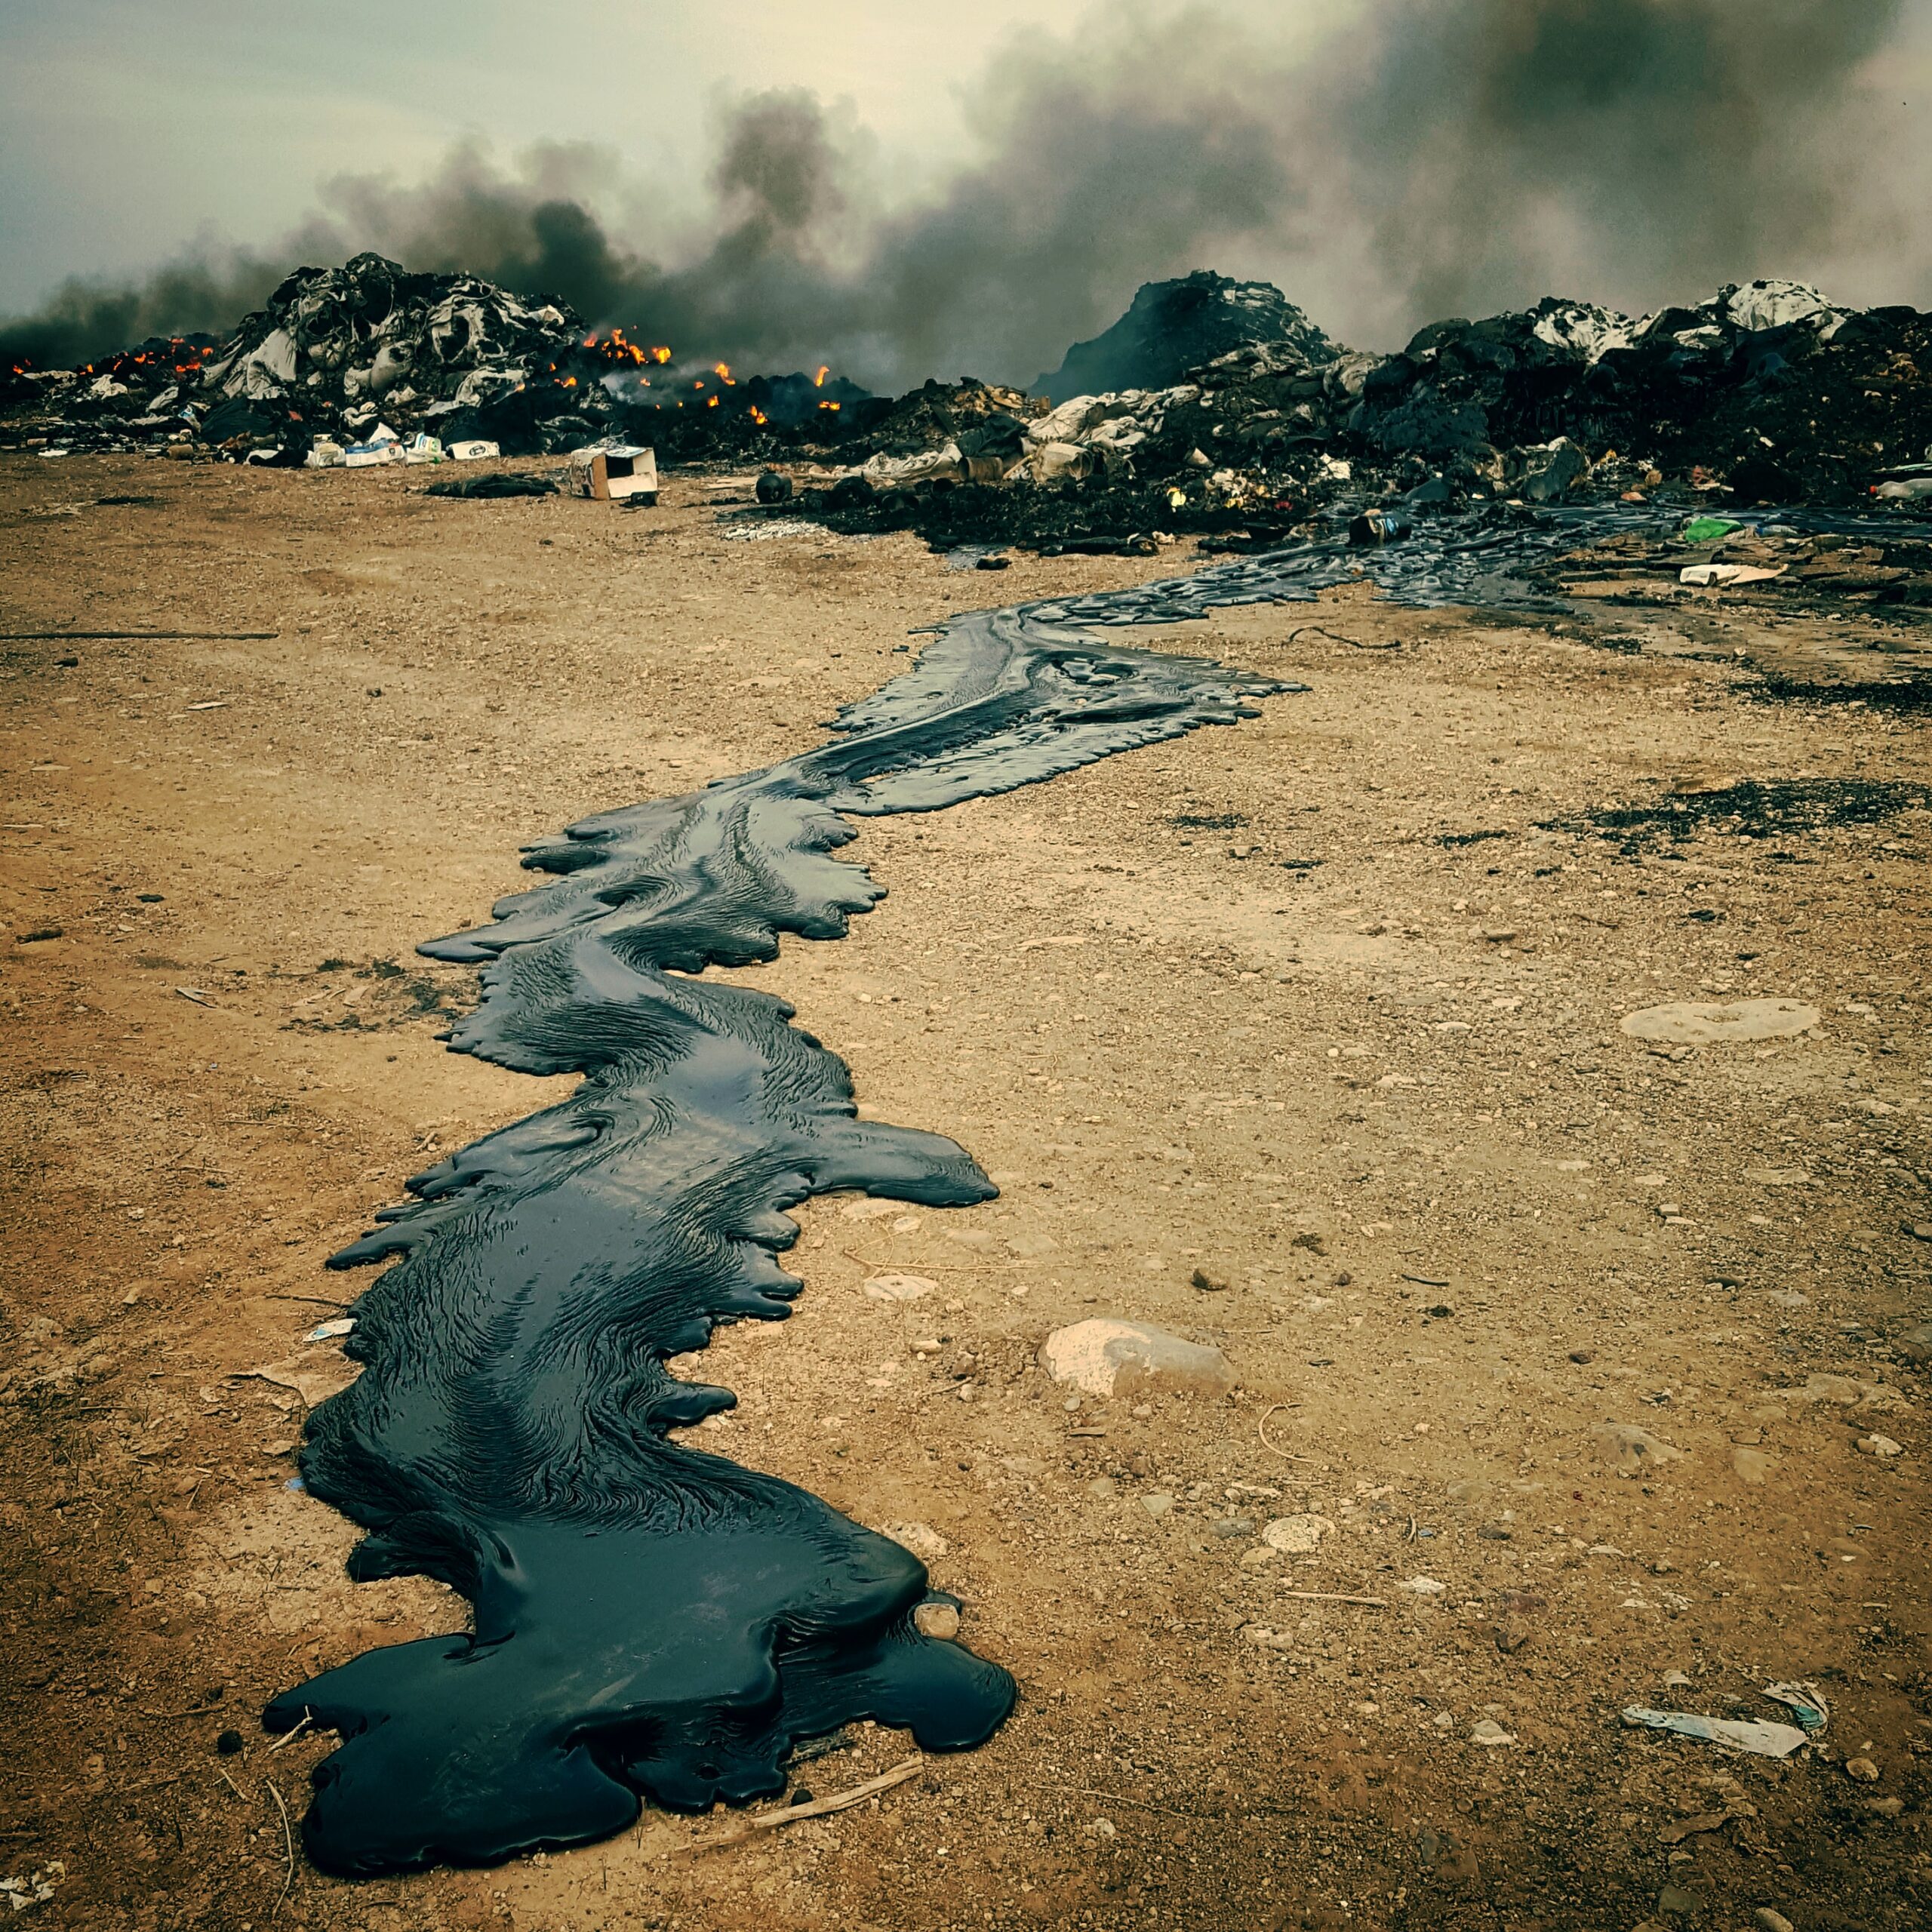
Oil waste flowing from a dump site south of Erbil, Nov 28, 2018: Credit Wim Zwijnenburg
Persistent oil spillages can affect the groundwater used by the general population and in agricultural activities. Livestock, wildlife as well as the wider natural environment and biodiversity can also be impacted.
Detecting the signs of such spillages is possible using satellite imagery.
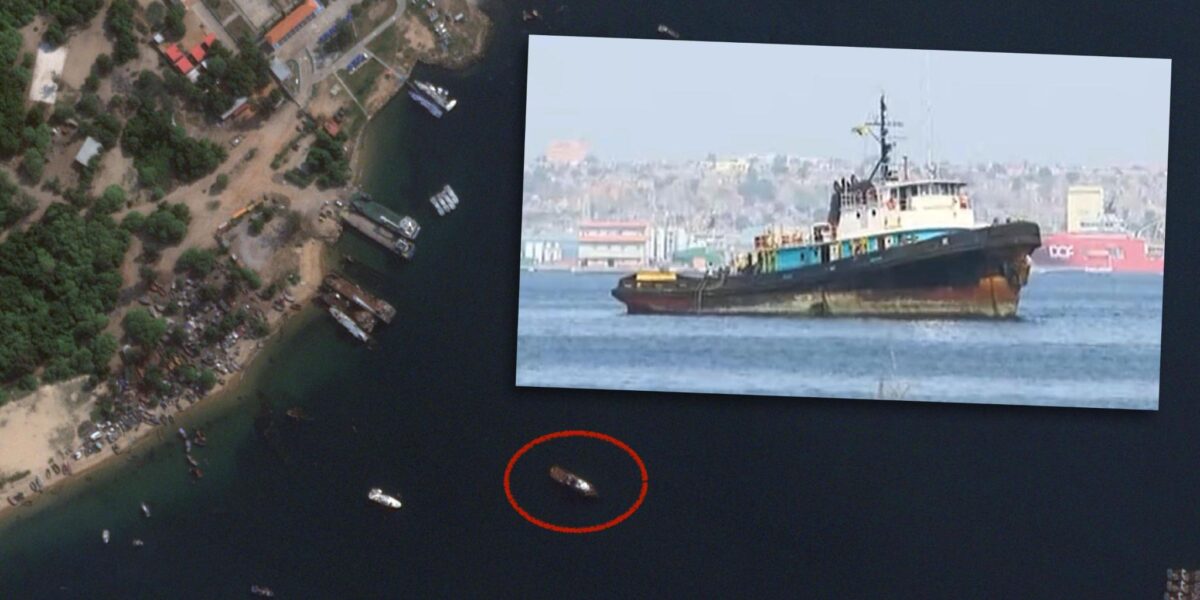
When doing so, there are a few key items that can act as visual clues. Distinctive storage tankers, as seen (coloured red) in the image below at a location, which was shut down in 2018, are one such item.
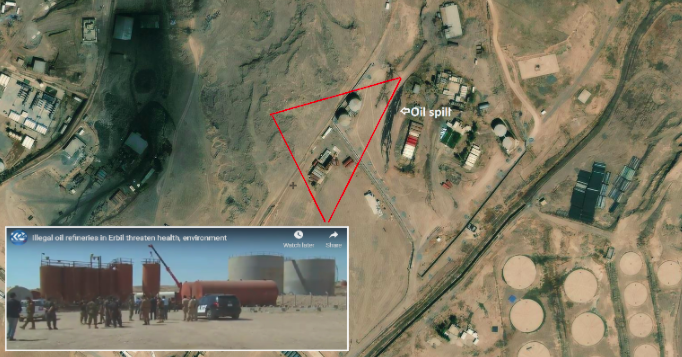
A Zoom.Earth image from 2018 details an area in the Kashe Industrial district where an oil spill is visible.
An oil spill is even visible in the image above which is accompanied by a video still from the same location.
However, it is important to keep in mind that not all images will include such detail or even that tanks visible via satellite imagery will be used for storing oil. Thus, it is important to check other sources for confirmation.
Let’s take another satellite image from the Kashe industrial district near Dohuk taken from Zoom.Earth in 2018.
Oil waste spills from small refineries at the Kashe industrial district are visible on high resolution satellite imagery via Zoom.Earth/MAXAR, August 2018.
Again, an oil spill does appear to be visible in this image.
The below satellite image, taken roughly 900 meters away, shows another refinery in the same district. Oil spills appear visible close to the red tankers visible within the marked area.
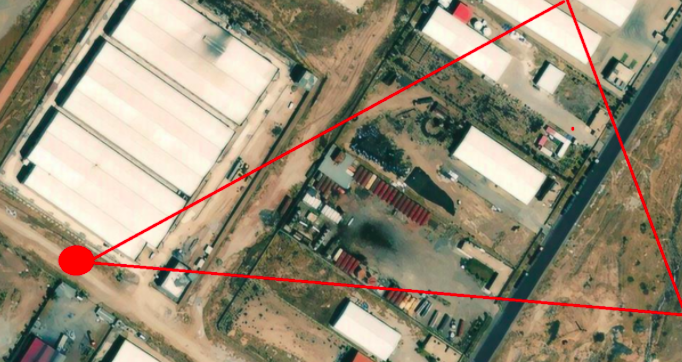
Oil spillages seen via Zoom.Earth imagery at a facility in the Kashe industrial district in August 2018
But with both these satellite images almost three years old, we are going to have to find some more recent information to be able to say or show that some form of pollution is still occurring in this area.
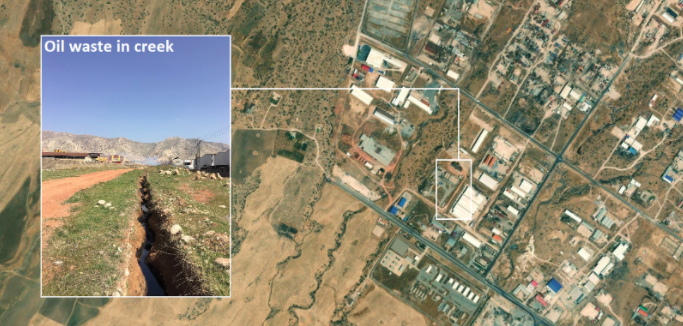
Fortunately, a drone image of the same refinery in the image immediately above was uploaded to Google Maps in March this year provides a closer view of the aforementioned storage tanks.
Oil can be seen leaking through the wall and trickling into a stream along the side of a dirt road.
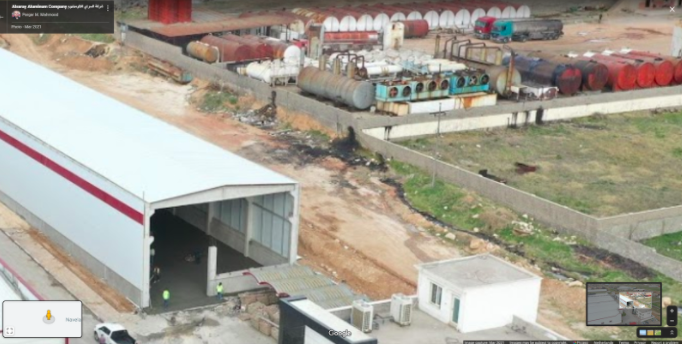
Oil spills can be seen leaking through a wall from a refinery. Image via Google Maps
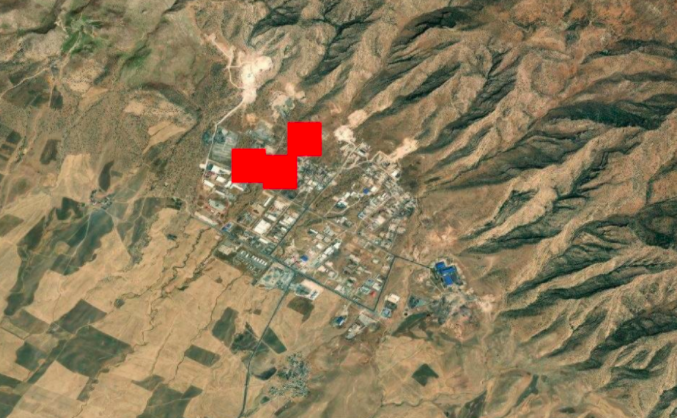
Further satellite imagery of the Kashe District appears to highlight an open-air waste pond just south of the refineries.
Planet Labs imagery shows the pond being constructed in April 2020.
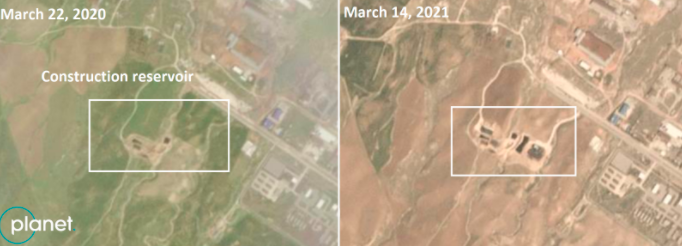
Planet Labs imagery showing the construction of an oil waste reservoir
To analyse exactly what was happening at this site, we ordered an Airbus Pleiades 0.5m resolution image via Sentinel Hub’s EO Browser at a small price of 6 Euros ($7).
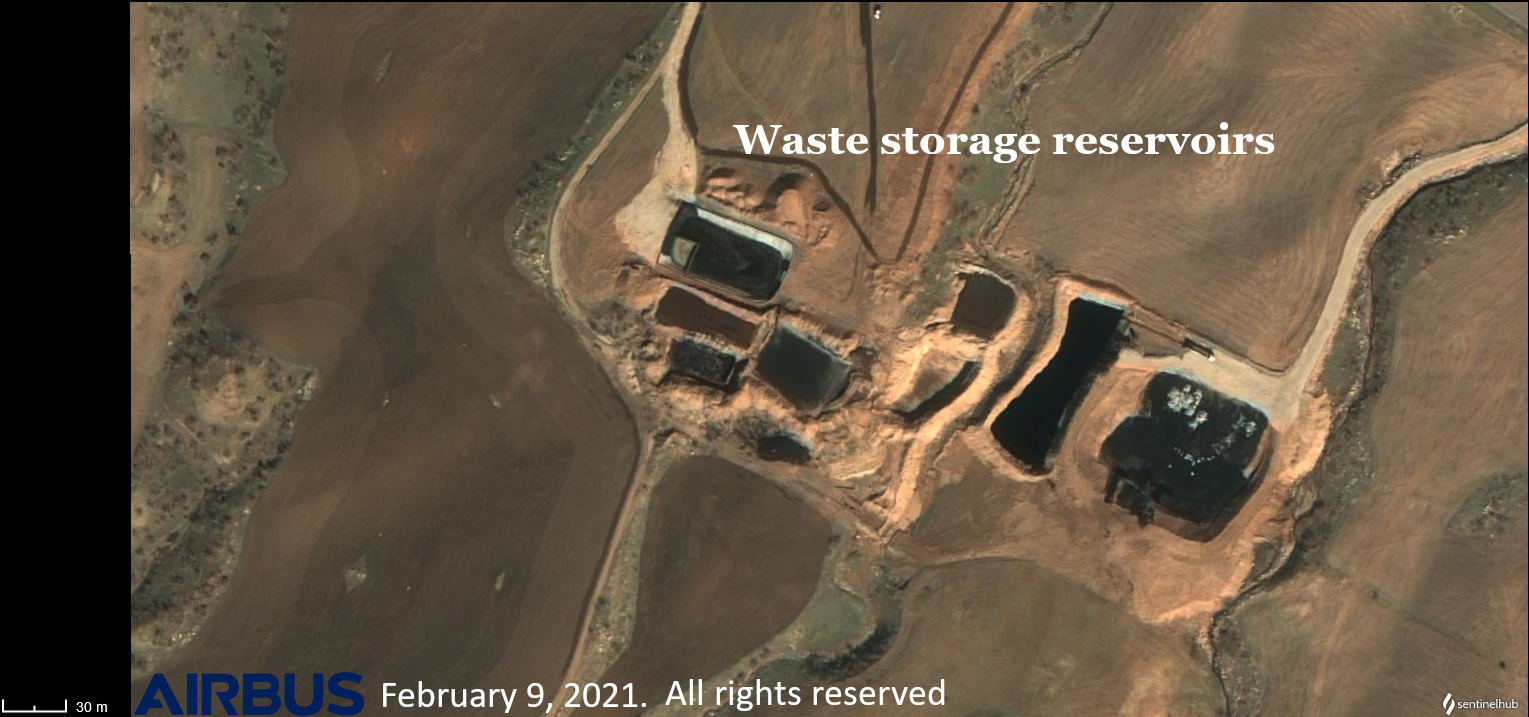
An Airbus high-resolution imagery showing an oil waste reservoir.
This pit appears to have been constructed to gather up and collect the waste water and bitumen/asphalt byproducts from refineries in the district.
While this is far better than dumping waste or allowing it to form into streams, open air pits can still pose environmental risks, depending on how they have been constructed. Heavy rain can even lead to them overflowing.
To further verify these findings, we contacted local journalists to see if they could build upon this research with some on the ground reporting in this district.
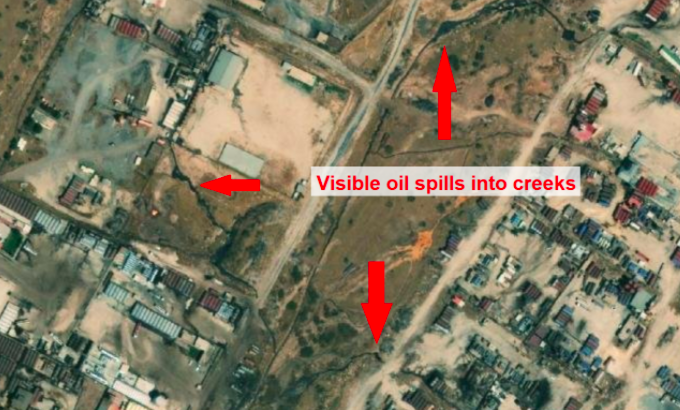
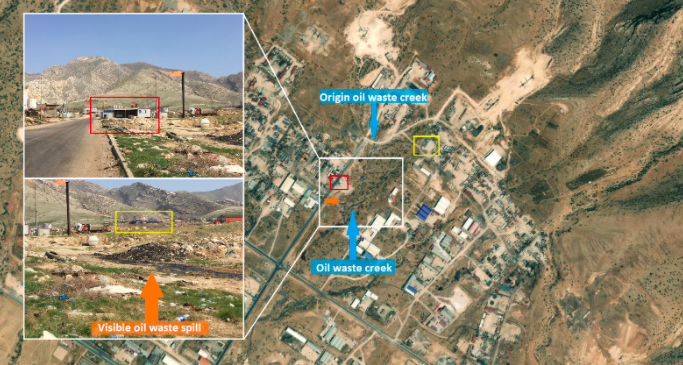
They visited the locations we highlighted in mid-March 2021 and shared several images of oil spillages pouring out of refineries.
Oil waste is seen flowing down from a cluster of refineries. Inset image taken in March 2021, satellite image via Zoom.Earth/MAXAR from August 2018.
Other images taken on the ground showed flaring stations in operation and oil waste in the north and east of the Kashe industrial district.
Oil waste and flaring can be seen in images taken in the north earth of the Kashe district. Images taken in March 20201, satellite image via Zoom.Earth/MAXAR is from August 2018.
In sum, by using a variety of air monitoring and earth observation tools, we have been able to track flaring and show how this contributes to air pollution in Iraqi Kurdistan.
Using open-source tools we have also been able to show oil spillages occurring at refineries in one industrial district near Dohuk. The same methods can be transferred to analyse other areas of concern in Iraq and beyond. The analysis we have been able to undertake also supports the work and reports of local researchers and academics who have long warned of the damaging impact of pollution from oil industry facilities in Iraqi Kurdistan.
Case Study II: Basra
Basra is Iraq’s second largest city and home to over four million inhabitants. In 2018, Iraq’s President designated it Iraq’s “economic capital”, largely owing to the vast quantities of oil extracted from the surrounding oilfields.
Studies have found hazardous levels of most major airborne pollutants are common in Basra. While local communities have raised concerns over the health impacts of the flaring.
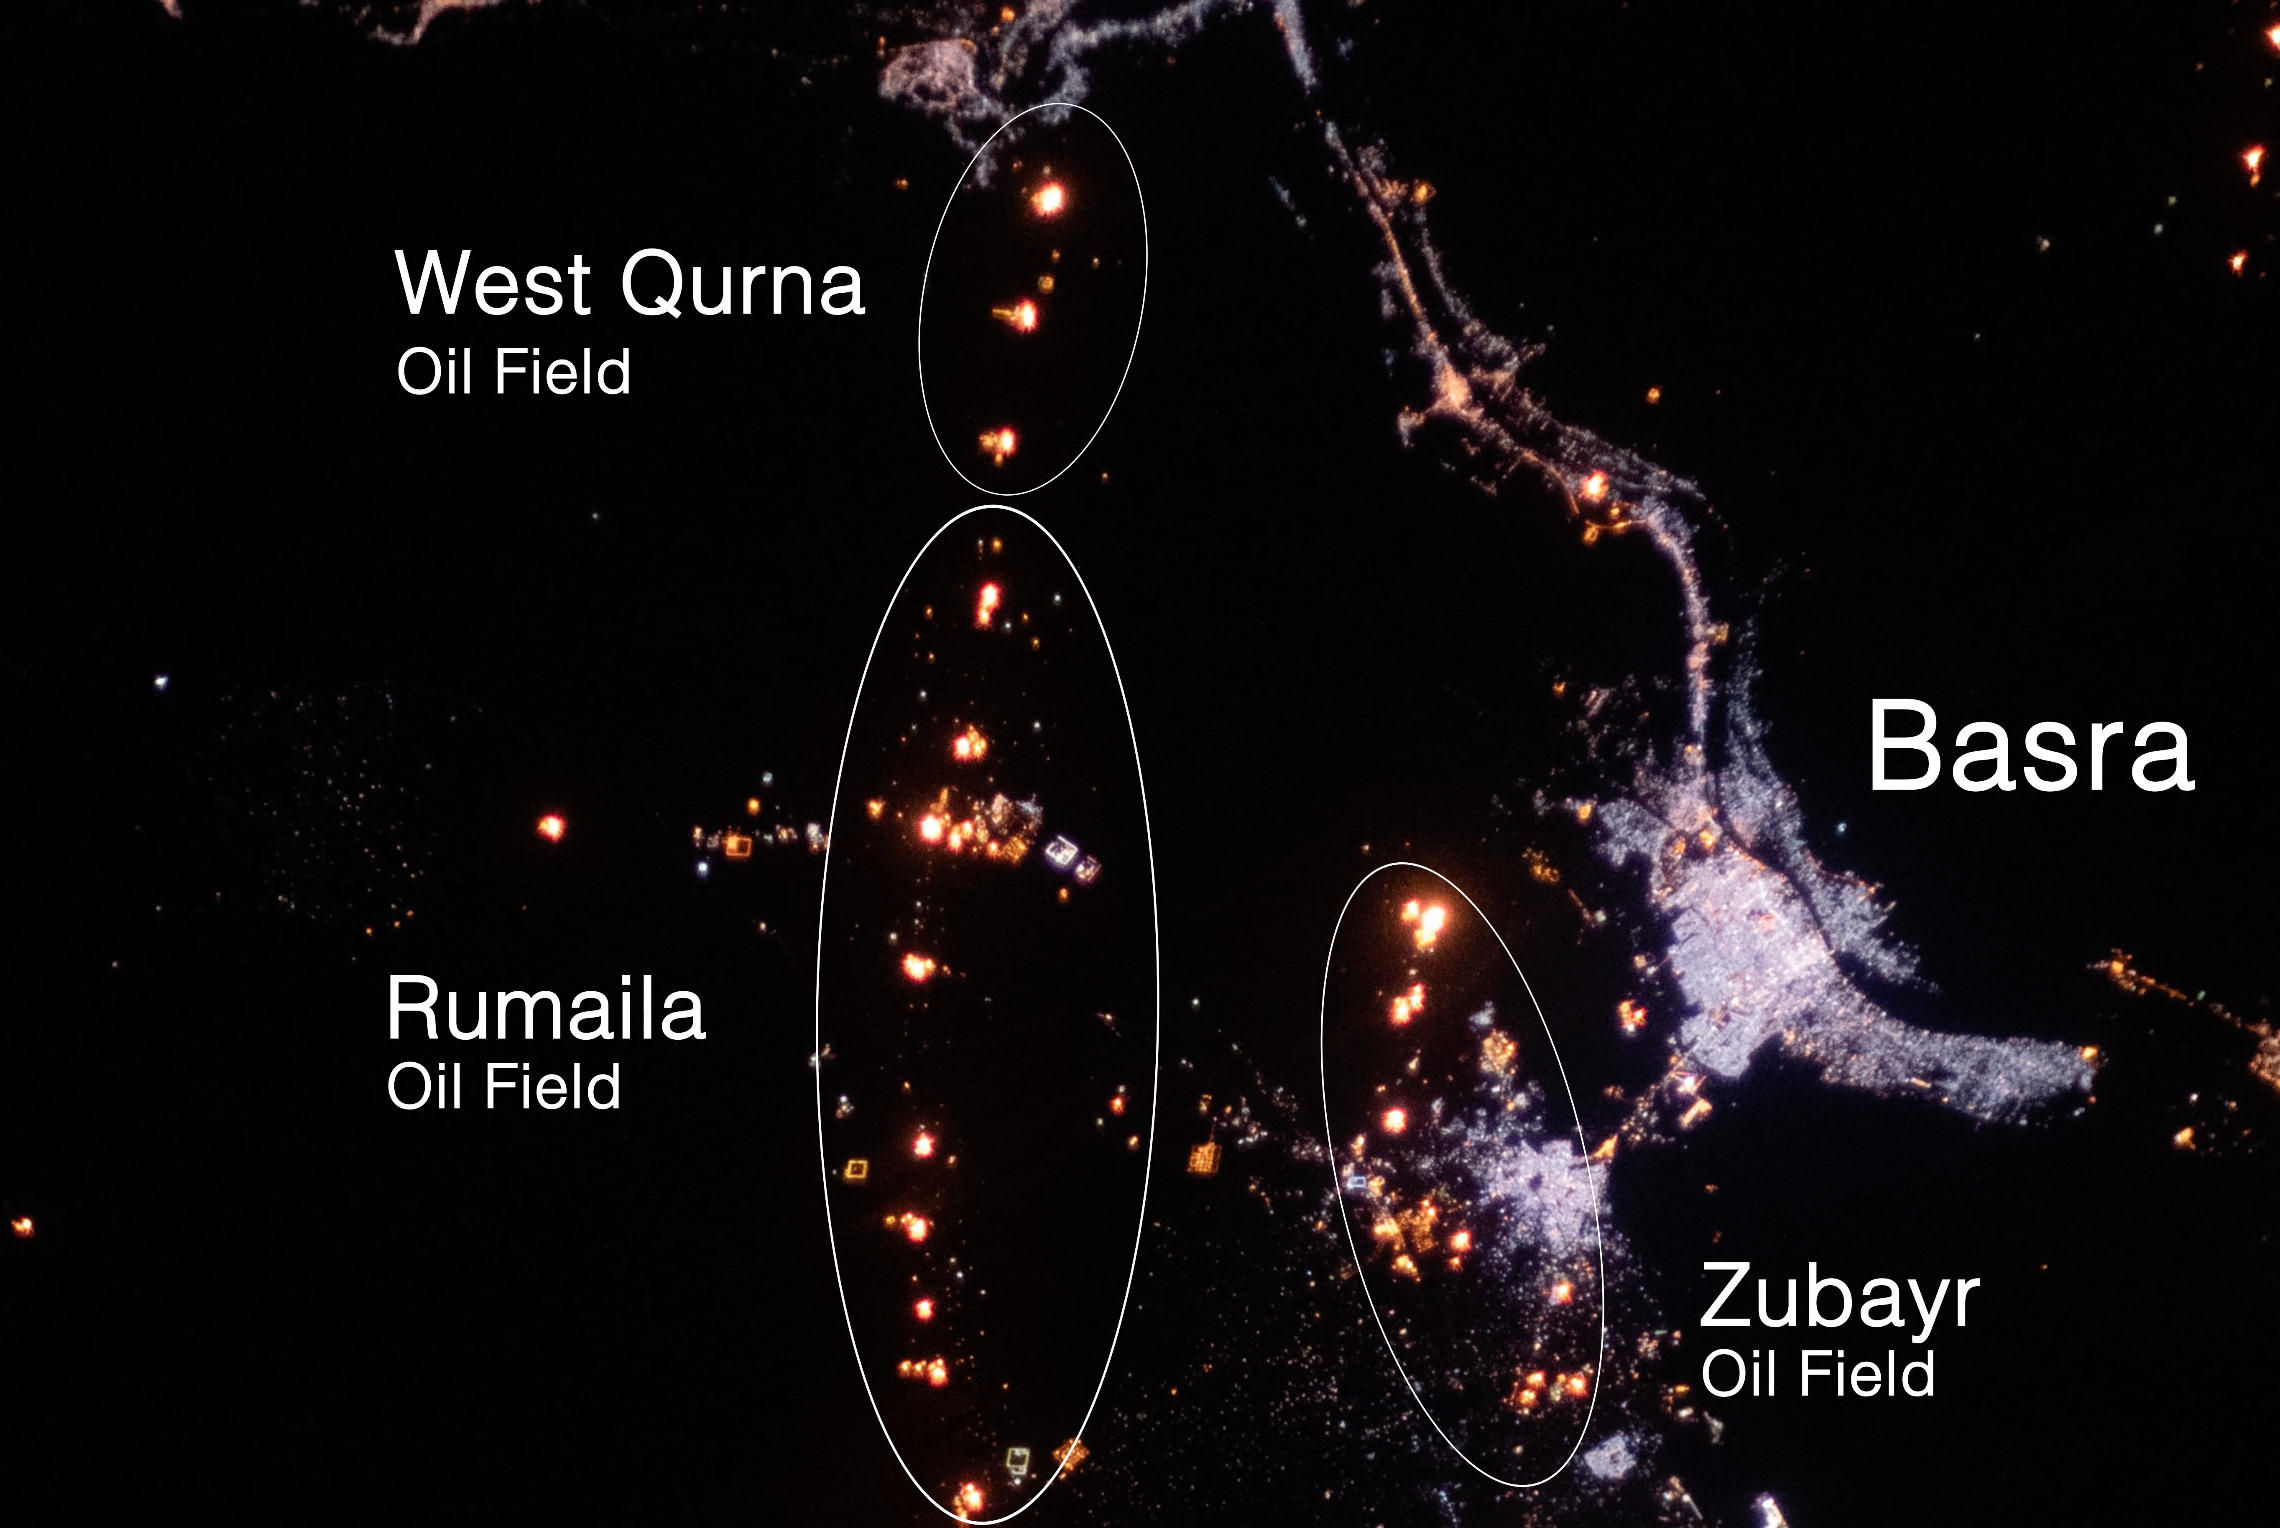
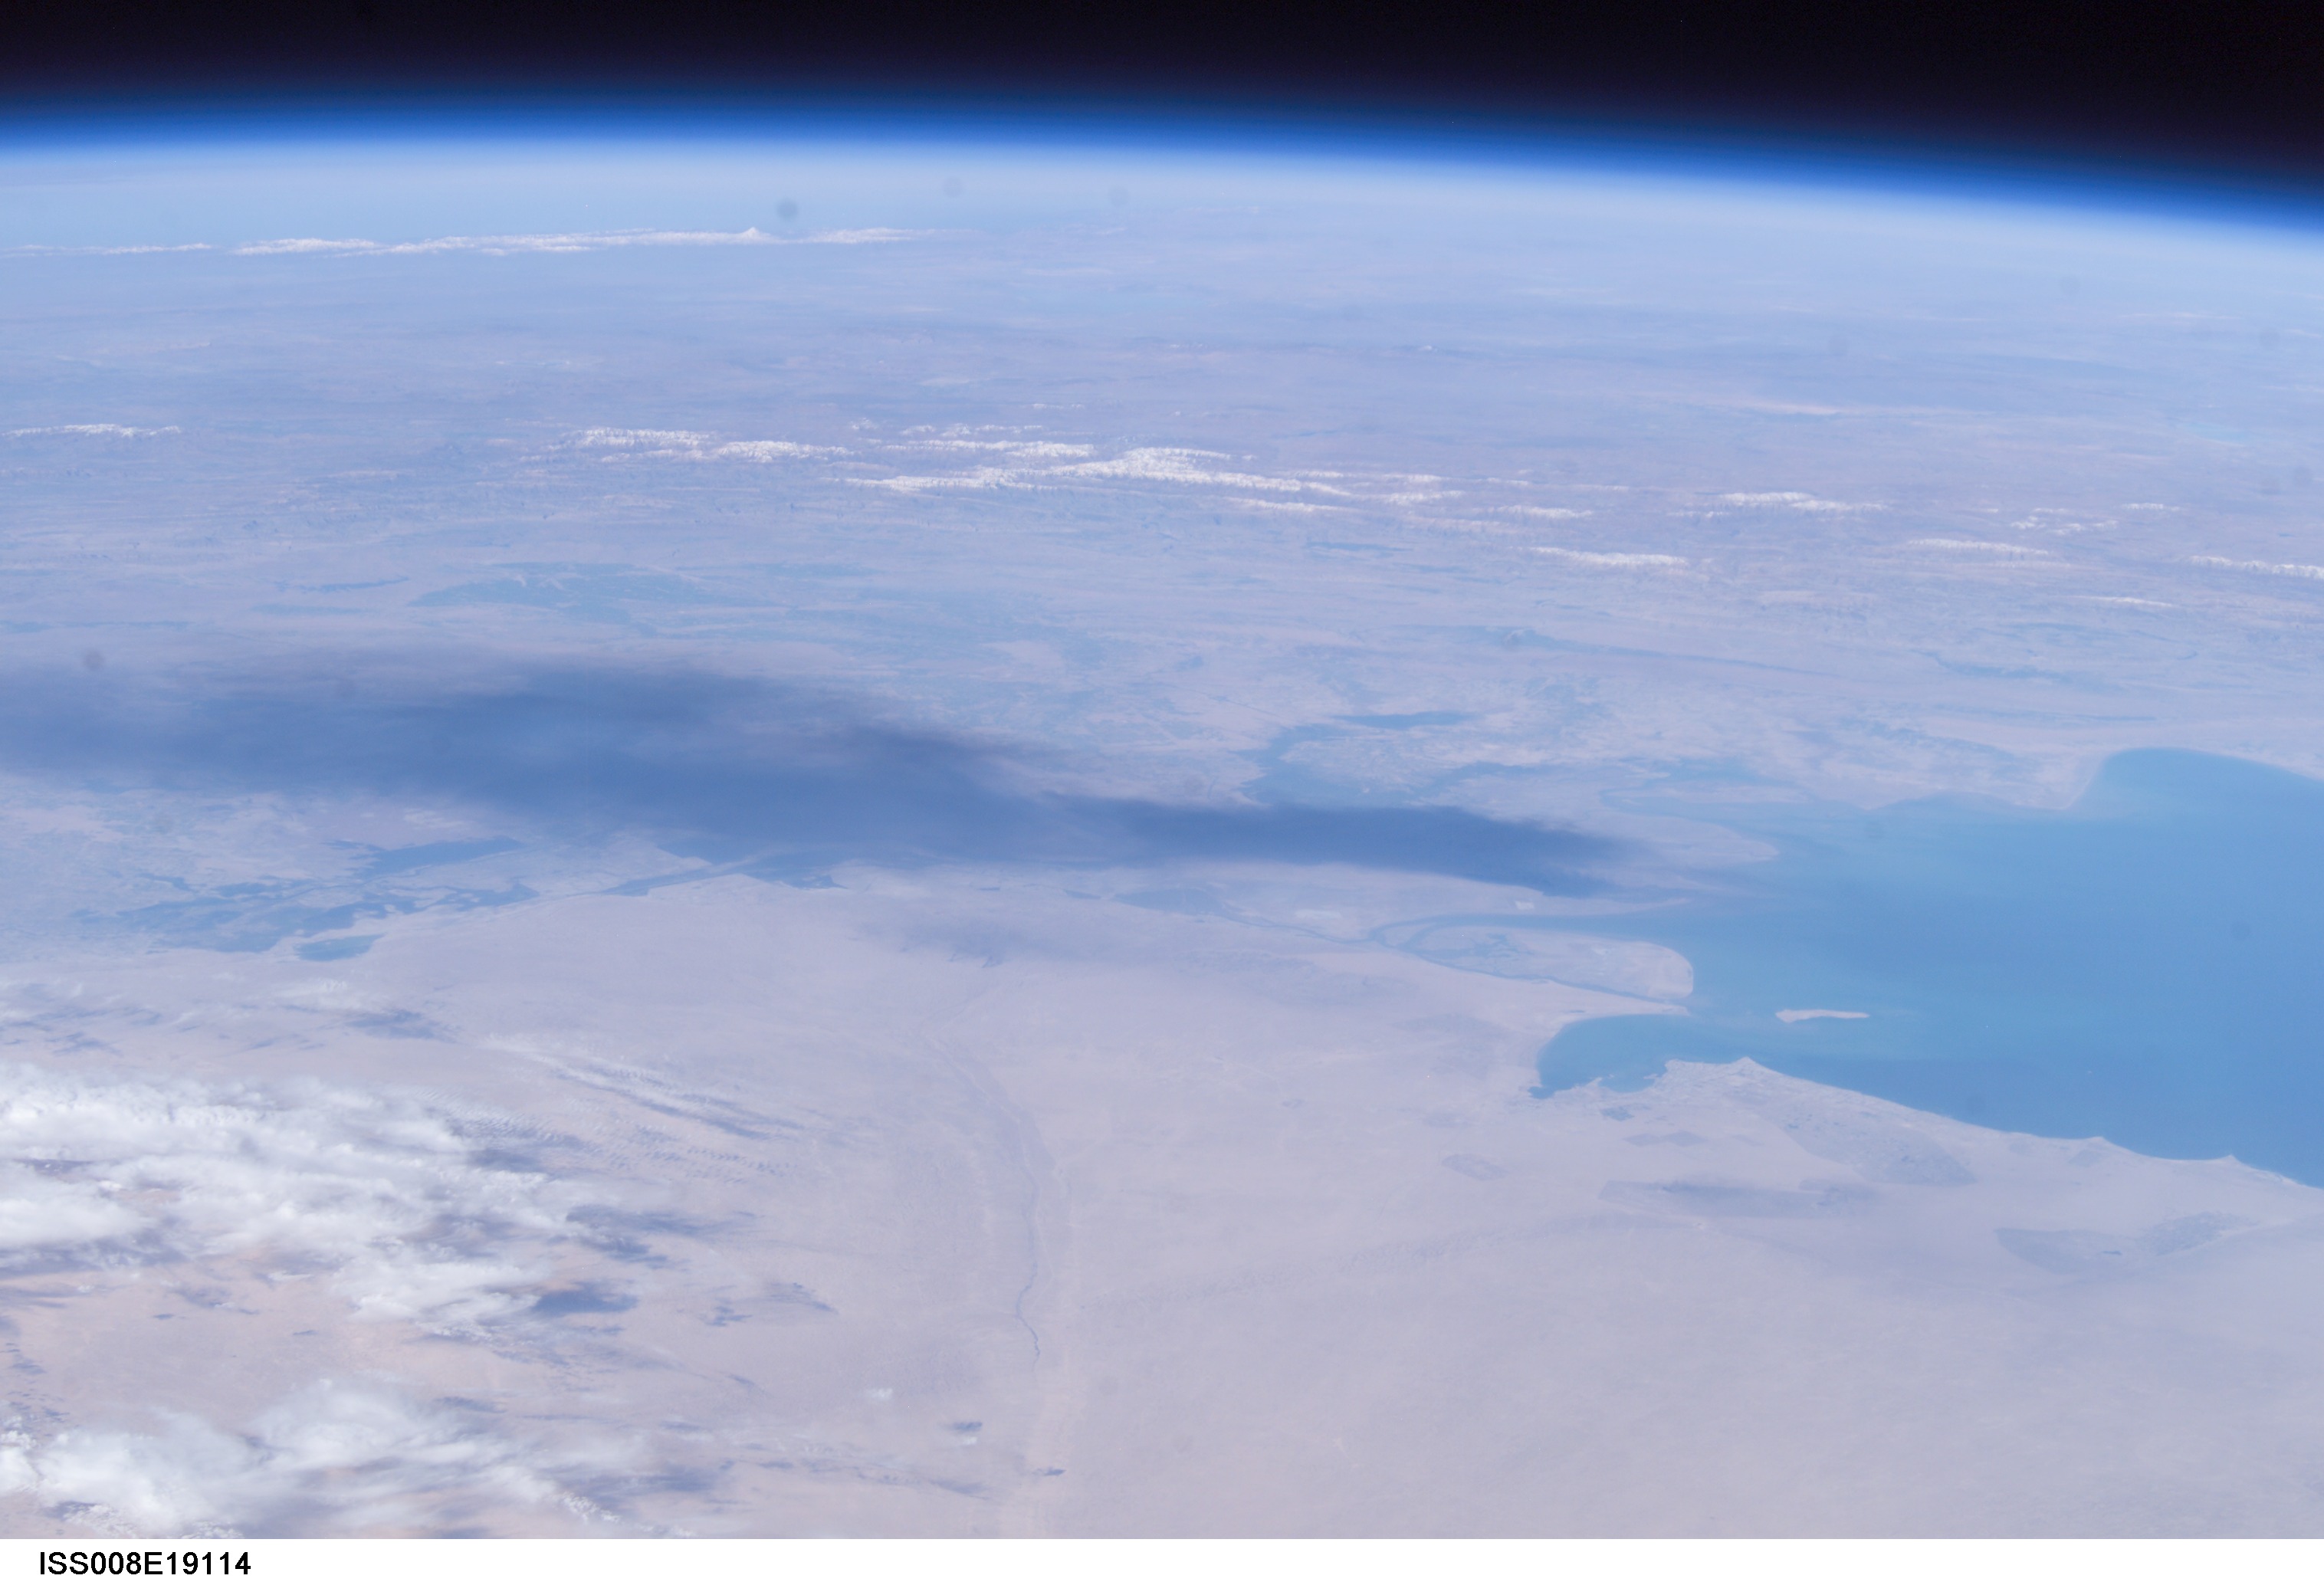
A night time image of Basra and surrounding oil fields taken from the International Space Station (Credit: Earth Science and Remote Sensing Unit, NASA Johnson Space Center)
The nighttime image above shows rows of flares to the east of Basra signifying the oil fields where flaring is occurring. The Rumaila oil field is the largest hydrocarbon deposit in Iraq, and the third largest oilfield in the world. It is responsible for an estimated 40% of Iraq’s oil production.
Though many of the international companies that operate these fields have made public commitments to reduce flaring, the volume carried out around Basra remains significant.
According to SkyTruth, the volume of gas flared within a 70km radius of Basra in 2018 exceeded the total flaring volume of Saudi Arabia, China, Canada, and India combined. Iraq’s flaring volume increased in 2019 and stayed roughly constant in the first quarter of 2020.
Shell estimated in 2009 that the wasted gas from flaring in Iraq could produce 3,500 megawatts per day — roughly 70% of of the country’s daily energy production. Data collected by the DMSP satellite (the precursor to VIIRS) shows night time lights signatures from the oil fields rising sharply in 2009, likely indicating an increase in flaring activity. More recent data from SkyTruth shows heat signatures from these oilfields remaining constant in the years since 2018.
These flares are also configured in a long row to the west of Basra, directly upwind of the city. Images captured by Sentinel-5p show the Nitrogen Dioxide from these flares being carried east by the wind, blanketing Basra in pollution.
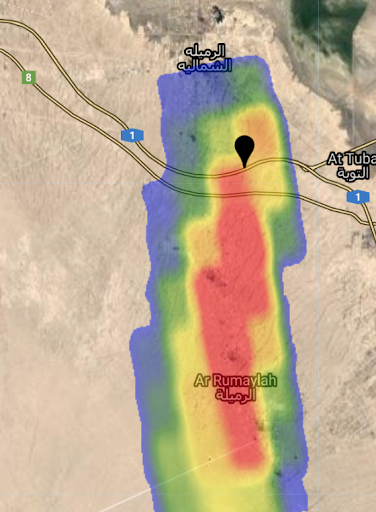
NO2 is visualised spreading over and near Basra in souther Iraq. Data and source code visible via Google Earth Engine. Source code visible in GitHub. Visualisation by Ollie Ballinger.
As the image above shows, the majority of flaring emissions in this oil field appears to come from a cluster of flares in North Rumaila.
While the changing wind direction creates long streaks of NO2, emissions can be seen consistently originating around North Rumaila. The graphic below highlights some of the likely sources.
Left: NO2 is visualised spreading from degassing stations one through four at North Rumaila. Data and source code visible via Google Earth Engine. Right: a still from previous graphic. Visualisation by Ollie Ballinger.
The complex at North Rumaila consists of four Degassing Stations operated by the Rumaila Operating Organization (ROO), a joint venture led by British Petroleum. The complex also contains a Natural Gas Liquefaction (NGL) plant operated by the Basrah Gas Company (BGC). Though there are degassing stations throughout the Rumaila oilfield and others like West Qurna, they are largely spread out.
Yet in North Rumaila, the four degassing stations and NGL plant are in close proximity to each other. Though wind directions frequently change, the prevailing winds consistently blow the pollution from North Rumaila Eastward towards Basra; plumes of NO2 can be seen stretching hundreds of kilometers in Sentinel-5p readings, often over the city itself. Bellingcat reached out to both ROO and BGC by email to ask about flaring at these sites but did not receive a response before publication.
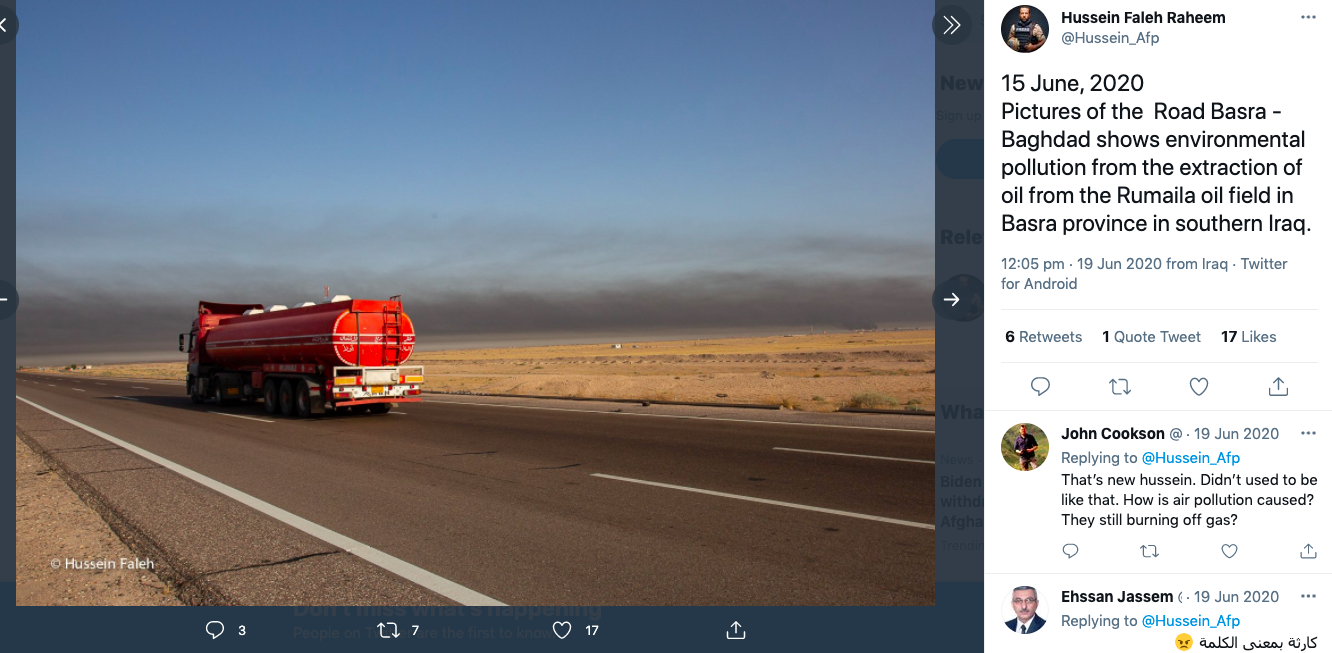
To understand what these colourful Sentinel-5p images look like on the ground, consider the images below, taken by local AFP photojournalist Hussein Faleh Raheem.
15 June, 2020
Pictures of the Road Basra – Baghdad shows environmental pollution from the extraction of oil from the Rumaila oil field in Basra province in southern Iraq. pic.twitter.com/xGAXBrIeNp— Hussein Faleh | حسين فالح (@Hussein_Afp) June 19, 2020
The images, posted on 15 June 2020, show thick clouds of black smoke billowing over the Basra-Baghdad highway. The first image (top left in the tweet) was geolocated to a westbound section of the highway near the Rumaila oil field using the two cell towers (shown in red and green below) on the right and the structure on the road (shown in blue).
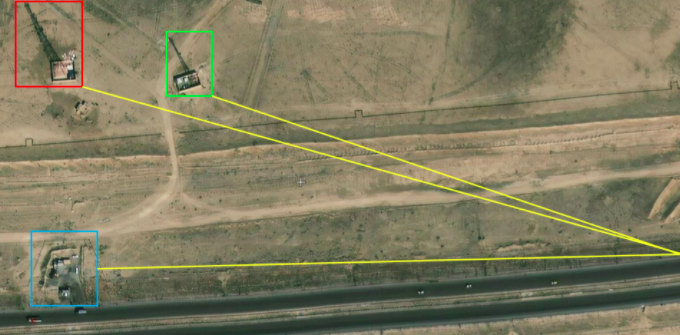
A screen grab from Zoom.Earth identifying features on the Basra-Baghdad Highway.
The following Sentinel-5P image from 15 June, meanwhile, shows a massive plume of Nitrogen Dioxide stretching south over the highway, emanating from the Rumaila field.
A screen grab from a Google Earth Engine visualisation showing NO2 emanating from the Rumaila oil field.
But another picture in the series posted by Fallh Raheem appears to point more precisely to one of the sources of this cloud being North Rumaila Degassing Station 2 (which is geolocated here and visible on the horizon in the centre-right of the image below which can be geolocated as being taken from here).
A screen grab of a tweet posted by journalist Hussein Faleh Raheem showing a plume of smoke drifting over the Basra-Baghdad Highway.
Using the same visual references as before (the cell towers are obstructed by the truck, though the tip of one is visible), the row of flares on the horizon to the north can be seen contributing heavily to the plume of pollution. Though it doesn’t appear to be the sole origin of the plume, a Sentinel-2 timelapse also shows those same flares at North Rumaila Degassing Station 2 billowing thick clouds of black smoke across the highway during June 2020.
A plume of smoke can be seen rising from North Rumaila Degassing Station 2. Data and source code visible in Google Earth Engine. Visualisation by Ollie Ballinger
As noted previously, the complex at North Rumaila is comprised of four degassing stations and a natural gas liquefaction plant, all in close proximity to each other and producing NO2 emissions. This likely explains why the plumes of NO2 originating from North Rumaila can be seen traveling hundreds of kilometers, often sweeping over the city of Basra.
Although the local oil industry has long stated its commitment to improved environmental protection, polluting practices are likely to impact public health and the environment. A recent epidemiological study found that cancer rates in Basra have increased by 30% since 2005. A similar study in Texas– another location in which BP conducts extensive flaring — found that women living in proximity to gas flares were 50% more likely to give birth preterm.
Though there are likely many other factors contributing to the rise in cancer cases in Basra itself, such figures are clearly concerning and emphasise the need for further research of the role of air pollution.
Like in Iraqi Kurdistan, however, this is only one factor contributing to environmental damage in and around Basra.
In our previous Bellingcat article on pollution in Basra’s Shatt Al-Arab, we documented a number of oil spills in the region.
A 2019 UN Environment Programme report on the state of Iraq’s oil industry, meanwhile, noted that old and poorly maintained oil pipelines across the country were leading to spillages that were having a significant impact on the livelihoods and health of Iraqi communities as well as natural ecosystems.
Such spillages certainly seem apparent around Basra.
A quick scan with high-resolution satellite imagery from 2018 and 2019 available via Zoom.Earth shows numerous open-air storage pits and pipeline spills at the various oil fields west of the city.
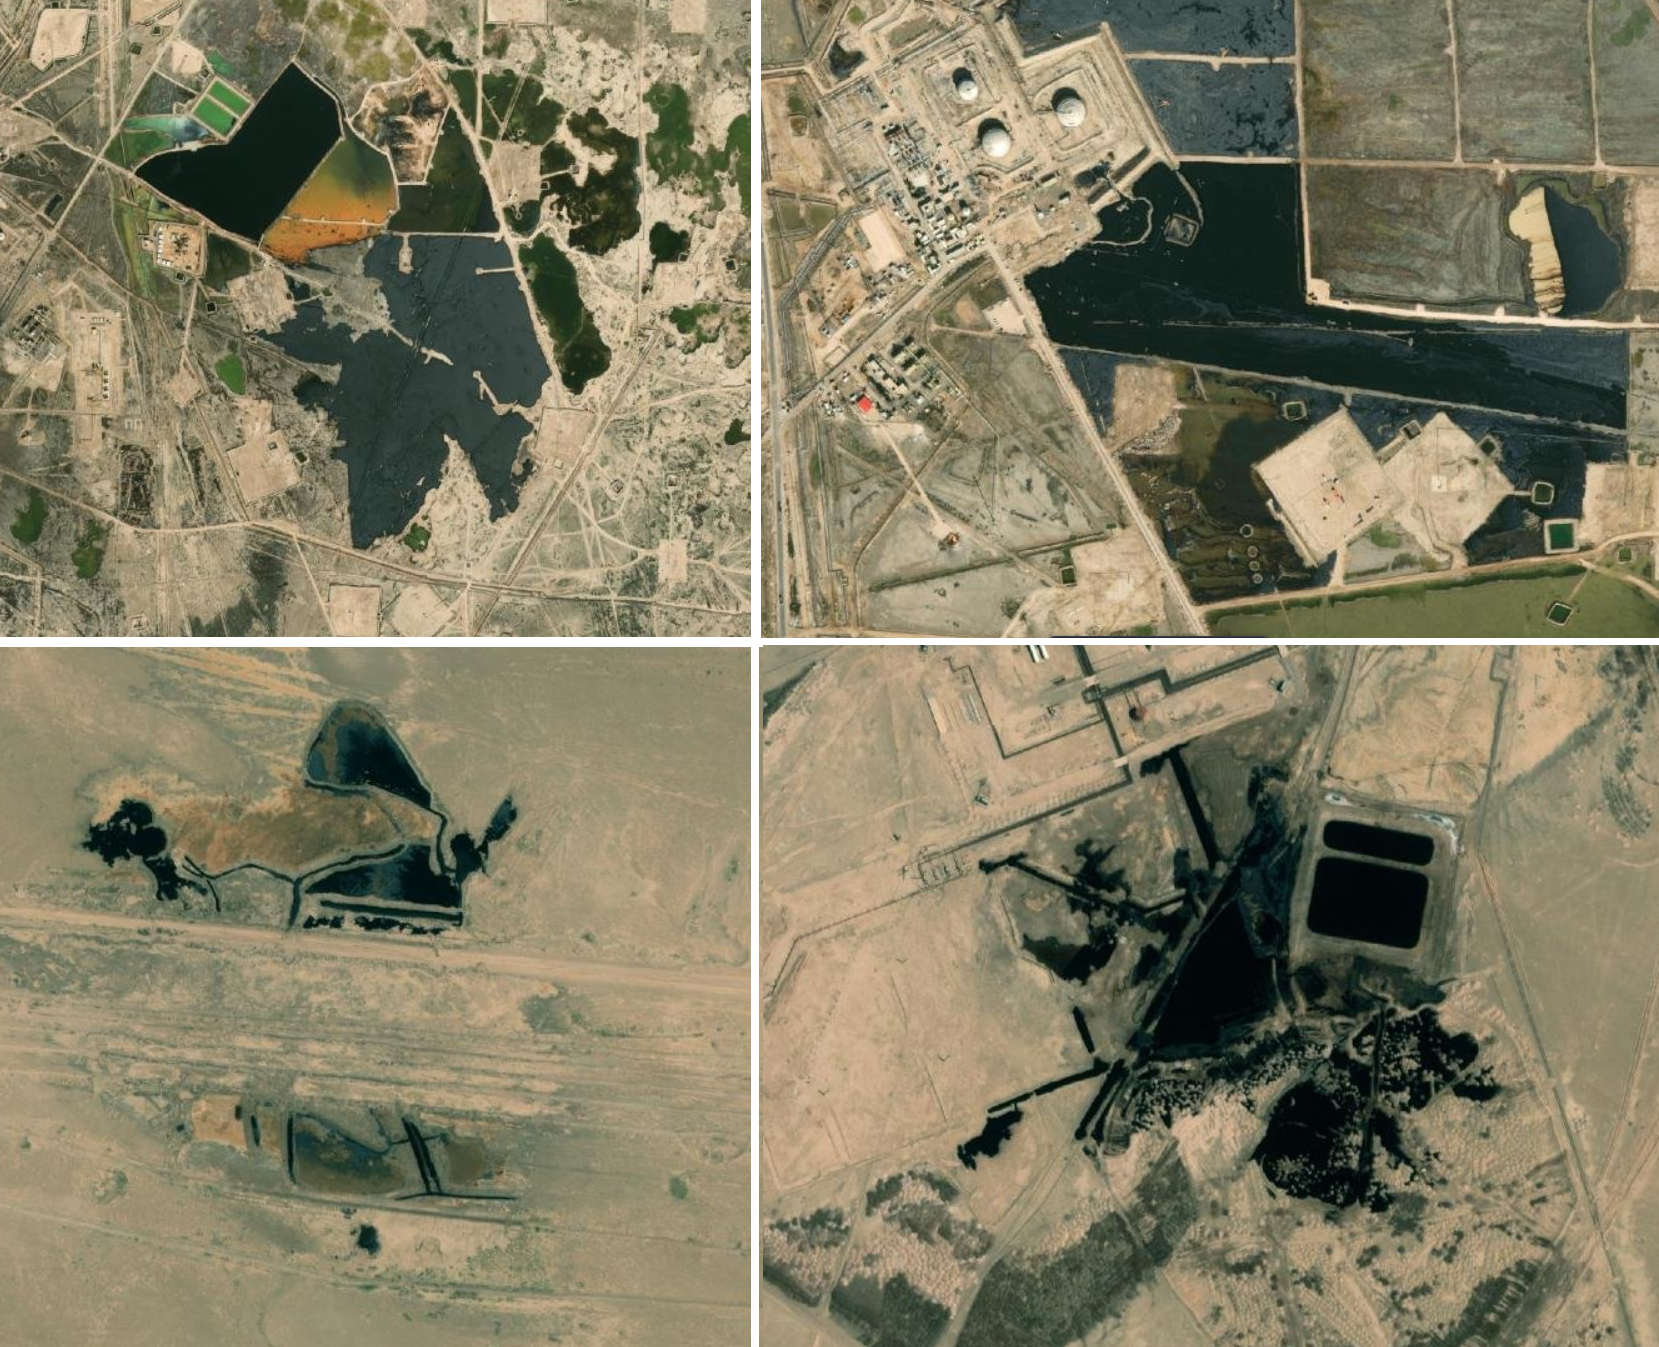
Zoom.Earth images of oil pits near Basra. Top left, Top Right, Bottom Left, Bottom Right.
While these images are useful and provide a good starting point, machine learning can help automate the detection of more recent potential oil spills as well as instances of likely ground pollution across thousands of square kilometres. Using radar and optical imagery (Sentinel-1 and 2) from August 2020, it is possible to train a Random Forest algorithm to identify oil spills. Feeding the algorithm images of areas known to be contaminated by oil (such as the areas shown above) allows it to learn and distinguish the unique spectral and textural profile of oil.
Below, the model identifies what appears to be polluted land in the West Qurna oil field at Degassing Station 8, operated by ExxonMobil. Calls by Bellingcat to the regional media offices of ExxonMobil to ask about the land highlighted here went unanswered.
A comparison of a Sentinel-2 image of an area of the West Qurna oil field with the output from a Random Forest algorithm trained to identify the spectral and textural profile of oil.
Orange pixels show land likely contaminated. This includes oil wastewater stored in open-air pits, pools of oil, and soot-covered ground near flaring sites.
In North Rumaila, a similarly diverse array of polluted areas appear to be visible.
A comparison of a Sentinel-2 image with the output from a Random Forest algorithm trained to identify the spectral and textural profile of oil around North Rumaila.
When applied to the three major oil fields in the region (Rumaila, West Qurna, Zubayr), the algorithm detects roughly 270 unique instances of potential contamination from oil.
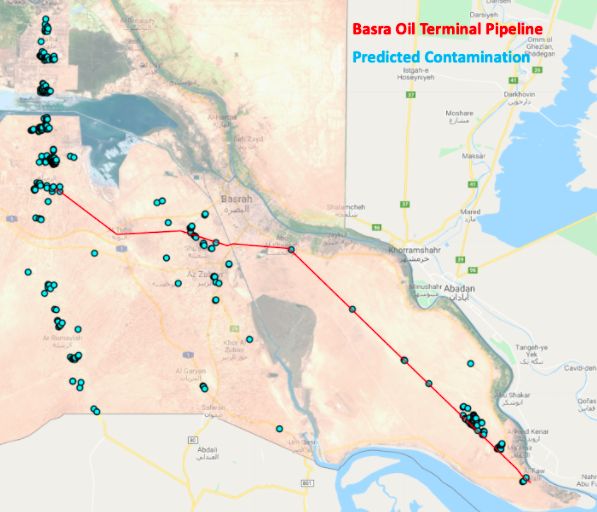
A screen grab from an interactive map showing potential oil spills or pollution near Basra. Source code for the map can be found here.
It is vital to note, however, that these 270 points are not confirmed locations of oil contamination.
Rather, they are areas that give off a similar spectral and textual profile as the polluted areas that the model was trained on. Again, many of these points are oil wastewater storage pits or sand blackened by flaring, while others might be false positives such as roads or dark water ponds.
To verify whether there is indeed pollution at a location indicated by the model, we can check against the Sentinel-2 basemap and conduct further research.
Several points are clustered along the Basra Oil Terminal Pipeline, which originates at the North Rumaila complex and terminates at the southern port city of Al-Faw. Leaks from this pipeline have been a longstanding problem, and several oil spills were recently verified on the ground near the pipeline’s terminus in this brief thread.
Ongoing spills from leaky pipelines keep contaminating land south of Basra, close to the Shatt al-Arab and Persian Gulf, as reported here via @hussam_sobhi. Seems there have been leaks for months near Al Faw, with reports of illegal tapping of crude from pipelines late 2020 https://t.co/3cf4kjm0TS pic.twitter.com/8sZiw7Qk1e
— Wim Zwijnenburg (@wammezz) January 13, 2021
Despite being trained on an area over 100 kilometres away, the algorithm clearly identifies the pipeline leaks at Al-Faw.
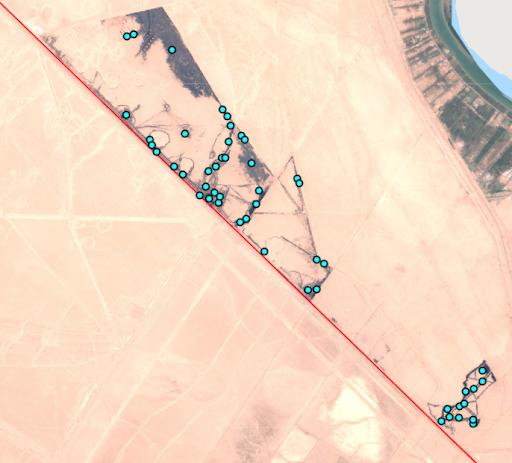
A screen grab from an interactive map showing potential oil spills or pollution near Basra. Source code for the map can be found here.
The tool even allows us to estimate the number of square meters affected; the Al-Faw pipeline spill covers around 29,000 square meters, an area roughly equivalent to the size of three soccer fields. Though leaks in the desert may appear harmless, a leak on the same pipeline some hundreds of meters away caught fire in 2004, creating a plume of smoke plainly visible from the International Space Station.
Below, the algorithm identifies another cluster of potentially contaminated areas around the Shuaiba refinery and the Basra Oil Terminal Pipeline.
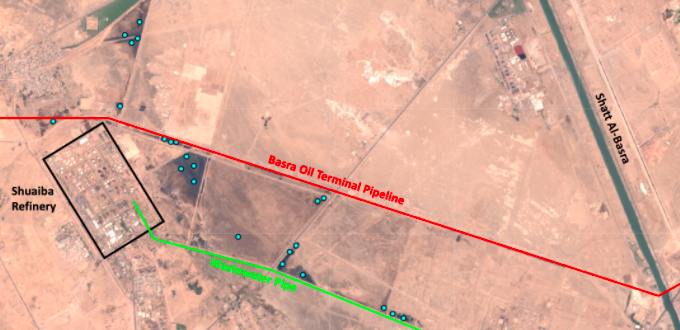
A screen grab from an interactive map showing potential oil spills or pollution near Basra. Source code for the map can be found here.
Many of the points are near the Shuaiba refinery’s wastewater infrastructure. A 2016 study monitored water quality at six locations in and around the refinery’s wastewater storage area, analyzing hundreds of samples over a six month period. It found extreme levels of water pollution not only in the direct vicinity of the refinery, but kilometers downstream the Shatt Al-Basra into which the refinery’s wastewater is dumped. Neither the operators of the Shuaiba Refinery nor the Basra Oil Pipeline responded to emailed request to comment before publication.
Again, it is important to be clear that not all points predicted by the model are actually pollution. Some notable mistakes made by the algorithm include these swamps in Az Zubair, which are not in fact huge oil spills, or open-air wastewater ponds.
Removing these false positives, numerous points appear clustered around refineries and oil infrastructure particularly in the Rumaila and West Qurna oil fields. Even though many of these oil facilities are located in the deserts and marshes outside of Basra city, open-air storage pits and spills can still have a damaging environmental impact.
The expansion of the oil industry at Rumaila and the marshes of West Qurna could be a serious threat to Iraq’s fragile biodiversity, as noted by Birdlife International. Hundreds of migrating birds recently landed in an oil waste lake which they mistook for water. The algorithm detects 58 likely instances of ground pollution in the marshland of West Qurna.
In the last few days, reports from Iraqi media indicated that thousands of birds got trapped in #oil lakes in Rmeilan, in southern #Iraq close to Basra. A good candidate for the location in img below
Source: https://t.co/LEmEPxd0QF
Possible location🌐: https://t.co/L9tUtInHS2 pic.twitter.com/PCnEqcD5JE
— Wim Zwijnenburg (@wammezz) September 29, 2020
Left unchecked, open-air waste pits and spillages will most likely continue to create local hotspots of oil waste that can impact wildlife and leave toxic scars in Iraq’s southern desert landscapes.
Again, open-source documentation through sensors and optic, public available imagery supports documenting the massive air, water and soil pollution problems in a systematic way that helps building a strong risk profile for nearby communities.
This should support accountability of the oil sector and government in dealing with these structural pollution problems.