Peering Beyond the Clouds: A Guide to Bellingcat’s Ship Detection Tool
Translations:
Editors Note: The tool detailed in this article has been developed as part of Bellingcat’s Tech Fellowship program and can be accessed in full here. Read Bellingcat’s investigation into grain exports at the Port of Sevastopol here.
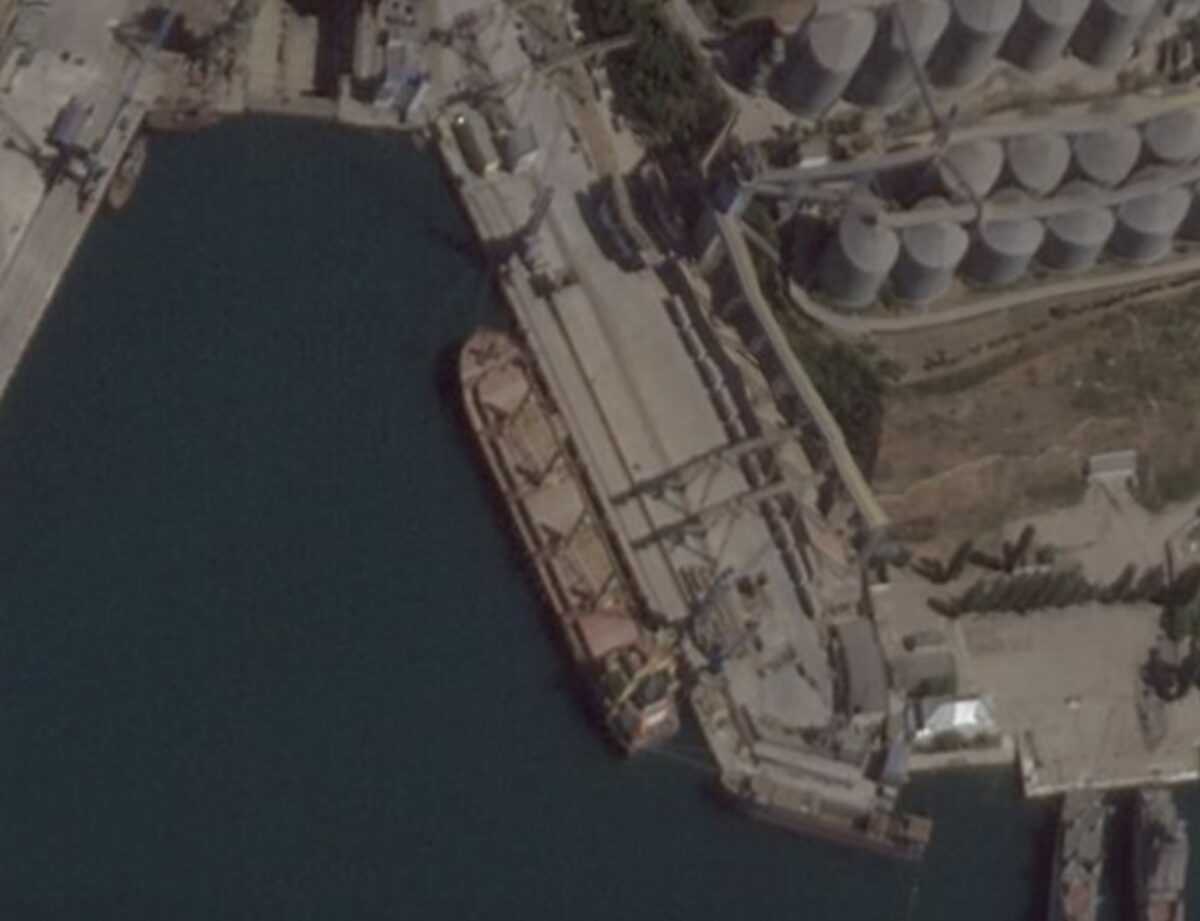
Ships have been covertly docking at a sanctioned terminal in the Crimean port of Sevastopol since the onset of Russia’s full-scale invasion of Ukraine.
Media reports have previously noted how individual ships had been docking at the Avlita grain terminal, contradicting Automated Identification Systems (AIS) tracking data that publicly monitors the movements of vessels.
Bellingcat’s full investigation can be seen here and raises questions as to what the ships have been loading and why the need for secrecy.
While Ukraine has accused Russia of “looting” grain from occupied areas in the south and east of the country, Russia has denied this.
Satellite imagery from Planet helped Bellingcat identify many of the days when ships were present at the terminal. But a tool developed as part of Bellingcat’s Tech Fellowship scheme provided further important details on days when there was no satellite coverage.
What follows is an introduction to the tool and its practical uses, as well as further explanation on how it was applied to monitor events at the Avlita terminal.
The Ship Detection Tool
The Ship Detection Tool is a satellite imaging tool that uses Synthetic Aperture Radar (SAR) imagery to identify ships in port, at anchor or at sea. It was critical to uncovering the presence of ships at the Crimean port of Sevastopol in the days and months after Russia’s full-scale invasion of Ukraine began. Bellingcat found that ships had docked at Avlita grain terminal (which has also been referred to as Aval in some media reports and registers) on at least 179 days during the first year of the war.
The tool itself is now publicly available here and can be used to carry out further investigations into vessel movements from sanctioned ports or for a variety of other investigative purposes.
How Does the SDT Work?
Instead of relying on reflected sunlight like optical satellites do, Sentinel-1 sends a pulse of radio waves. It then uses the echo generated to gather information from the earth’s surface.
When Sentinel-1 sends a pulse of radio waves onto a flat surface like the sea, very little is reflected back to the satellite. This low return signal on a SAR image means a darker colour will be presented.
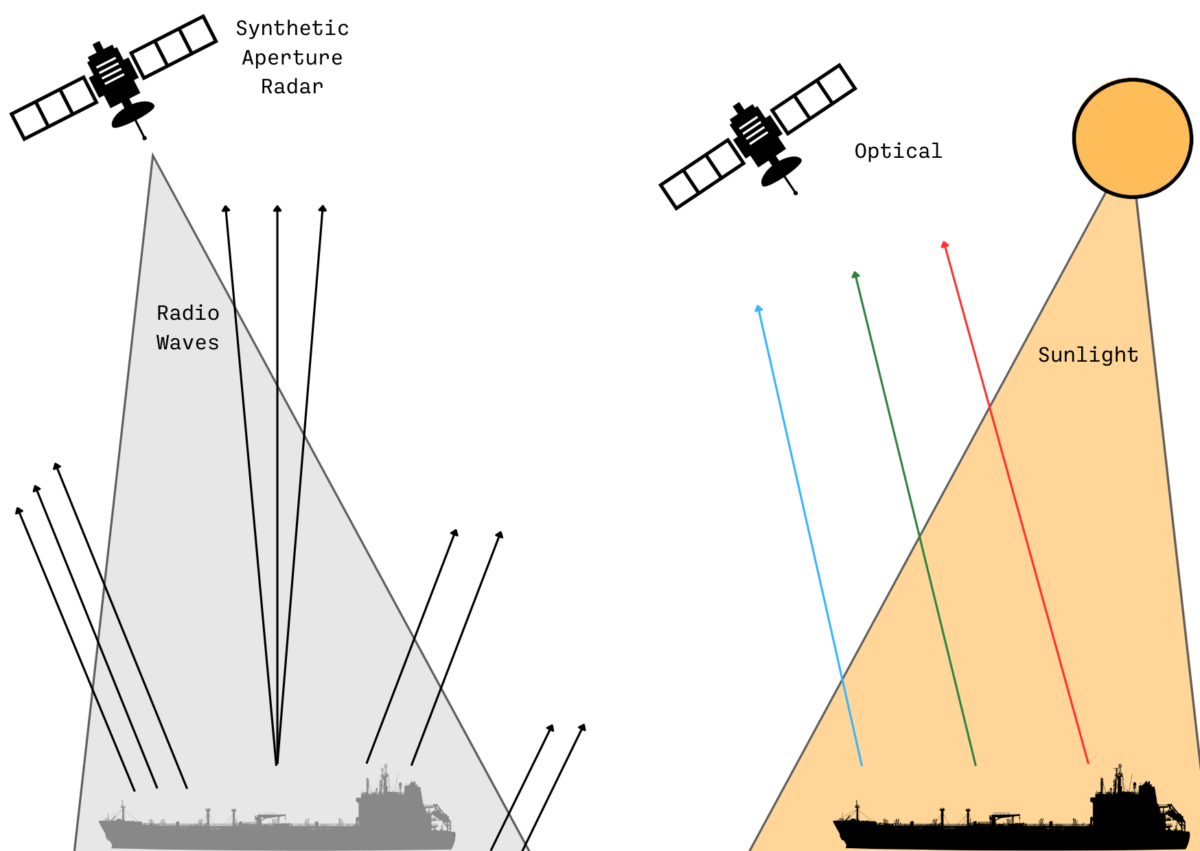
But when the radio waves hit a ship they generate a higher return signal, and therefore a much brighter colour.
This not only makes detecting ships fairly straightforward, the pulse of radio waves can penetrate through clouds and even image at nighttime meaning far more consistent coverage.
Using the Ship Detection Tool
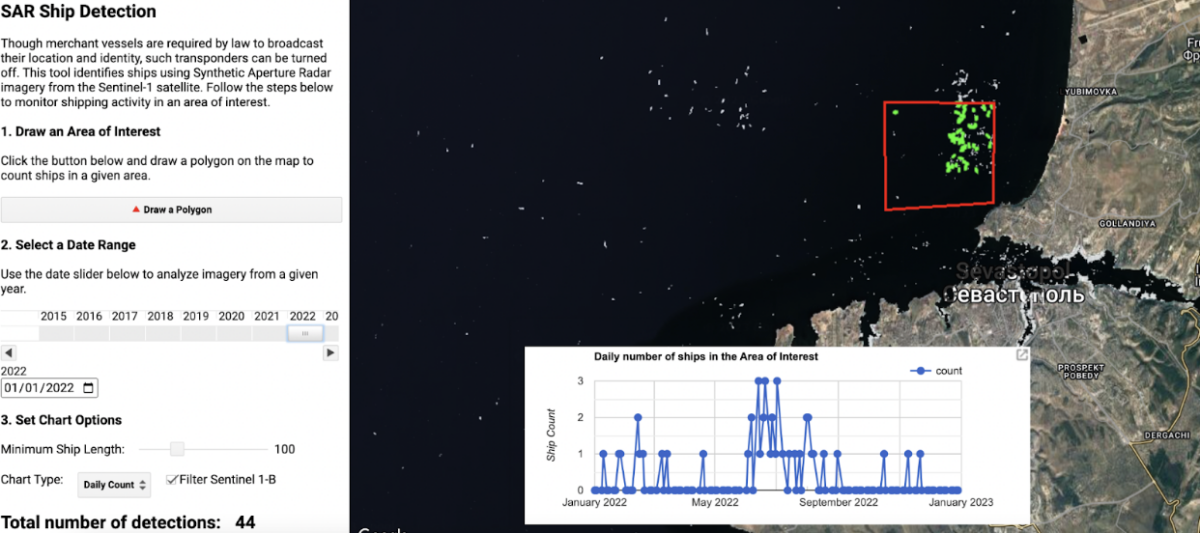
Upon opening the SDT, users will be presented with its default page.
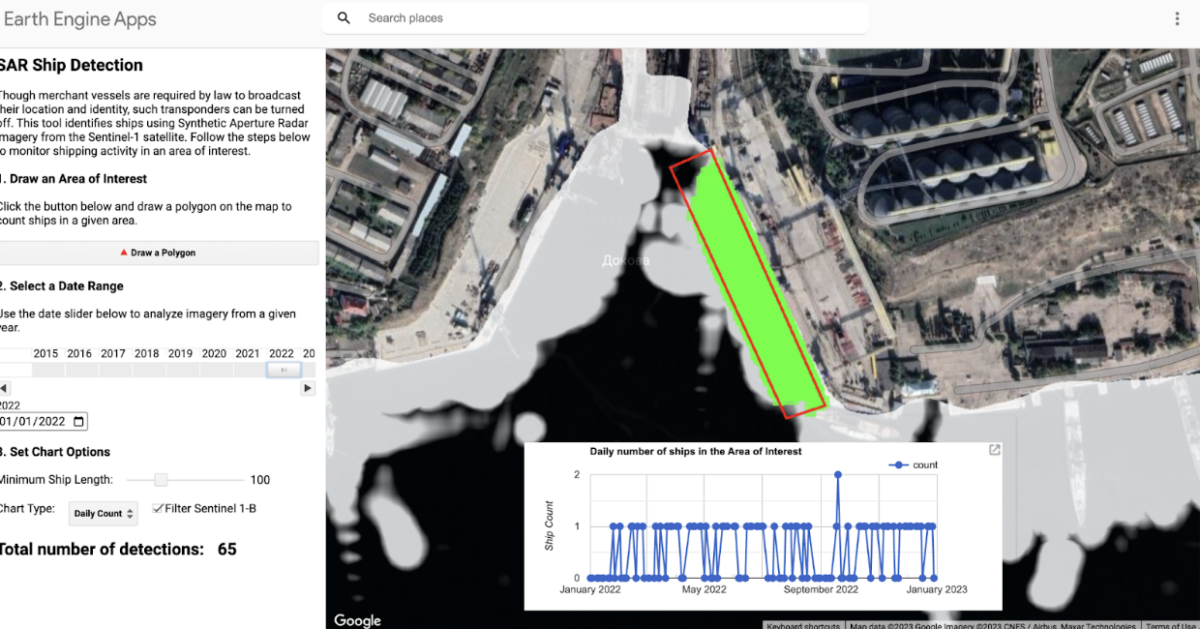
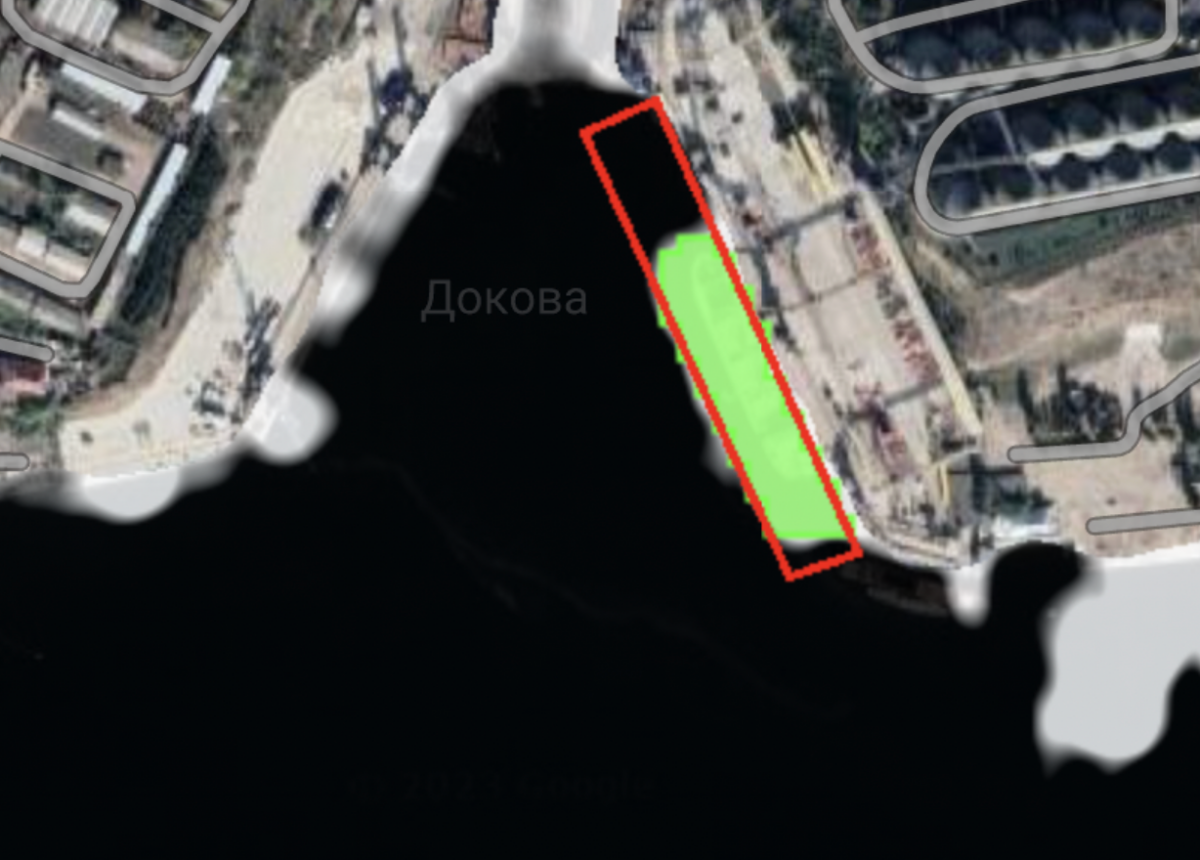
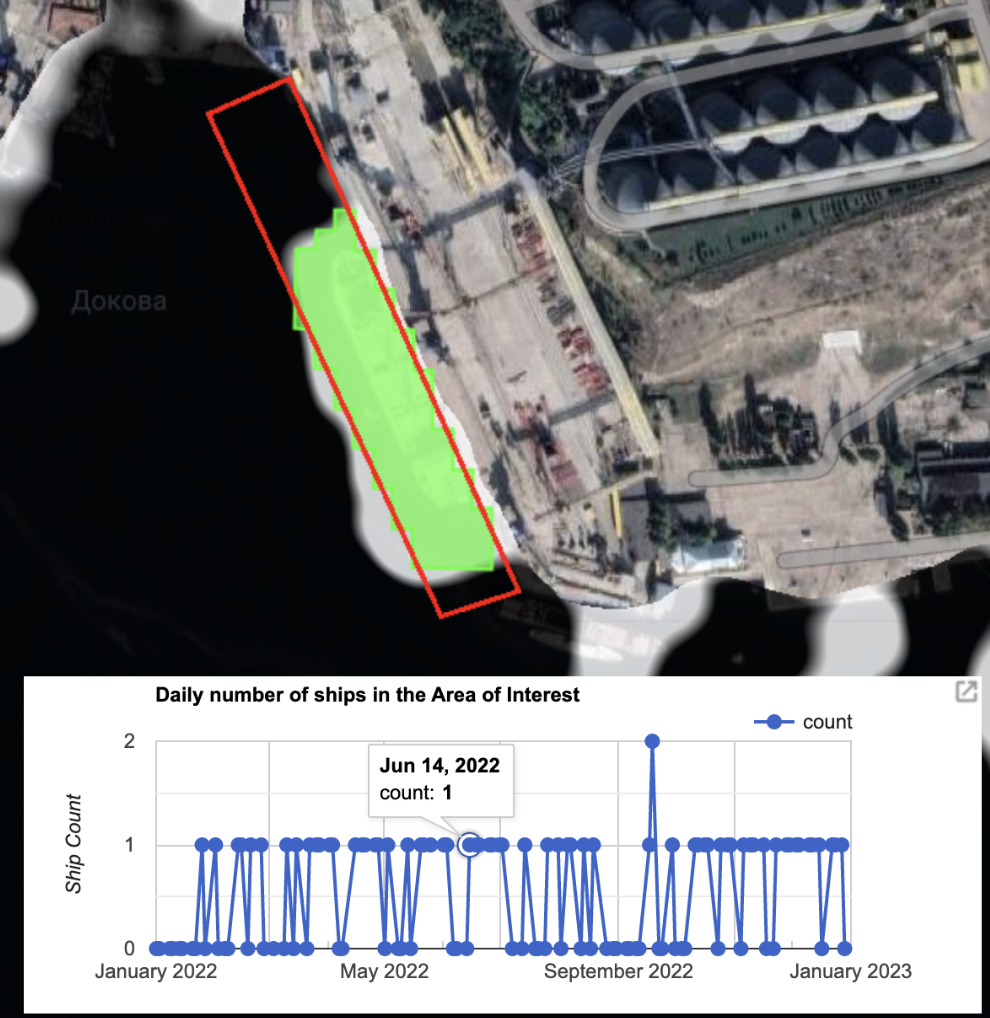
The map shows a red square which represents an Area of Interest (AOI), which is by default centred along the loading berth of the Avlita terminal.
Within the AOI, all ships detected over the course of the indicated year are shown in green.
The above chart shows the daily count of ships within the AOI over the course of 2022. Clicking on June 14 will display radar imagery from that date, as seen below.
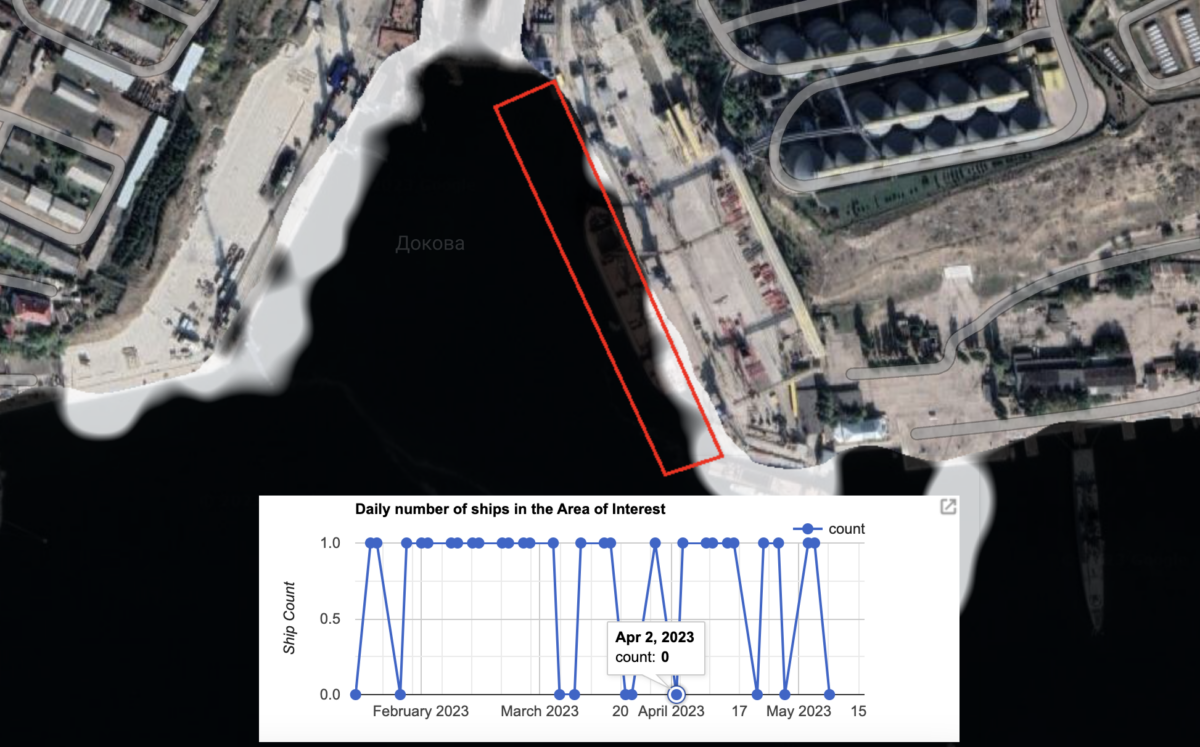
Clicking on April 2, when no ship was detected, indeed shows the AOI to be empty.
SDT Options
The panel on the left of the tool (within the blue box below) allows users to monitor ship traffic in a given area, be that in Sevastopol or elsewhere, in the three steps outlined below.

1. Draw an Area of Interest
First, click the “Draw a Polygon” button, and draw an area of interest (AOI). In the screenshot above, the AOI is indicated by the red box on the map. Drawing an AOI along the berth of a port will reveal the frequency with which ships over a given size are spotted docking there.
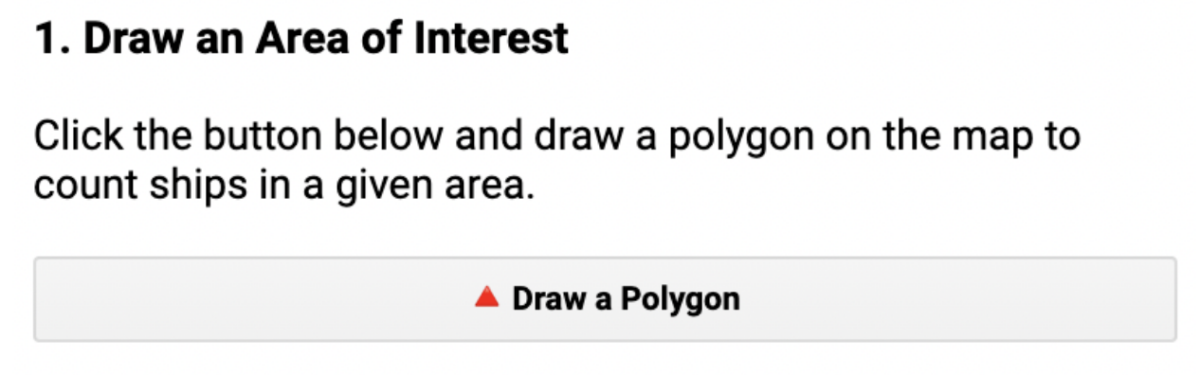
However, an AOI could also be drawn over a larger area such as an anchorage area or the mouth of a port. Very large AOIs may take a long time to run.
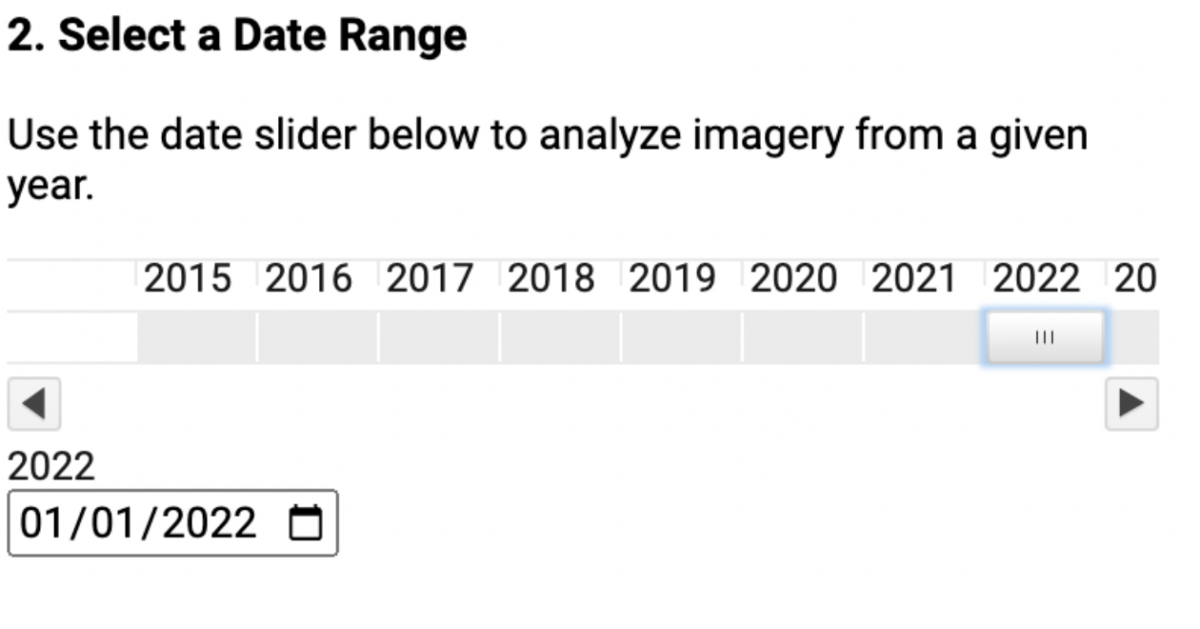
2. Select a Date Range
After the AOI has been drawn, users can specify a date range to analyse. The default is 2022, but imagery is available as far back as 2015, with new imagery being ingested automatically as it becomes available.
Keeping the default AOI drawn for the Avlita terminal but shifting the date slider to 2021 shows the frequency of ship detections to be relatively low, with only 31 detections.
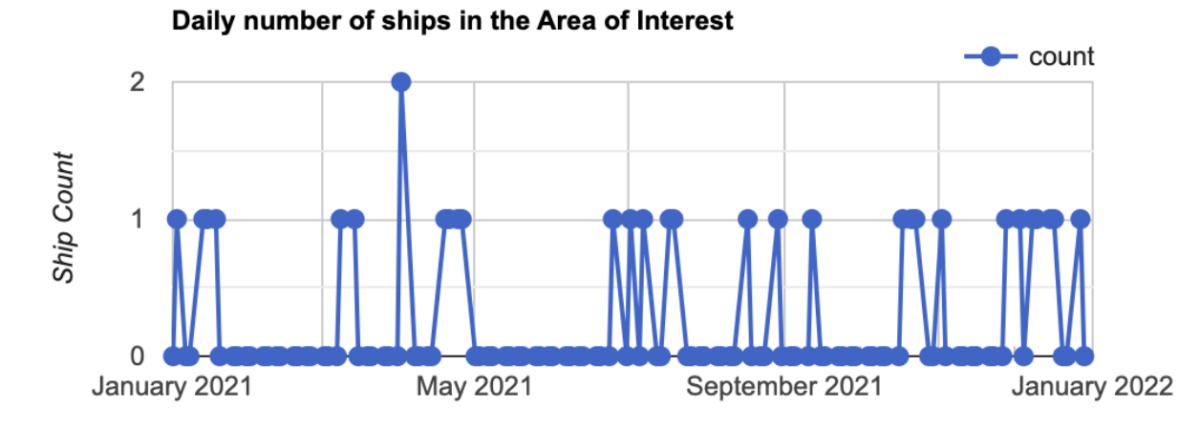
The chart shows prolonged gaps, sometimes several months long, between when ships were detected at the terminal. In 2022, by contrast, there are 65 detections and rarely a gap of more than a few days.
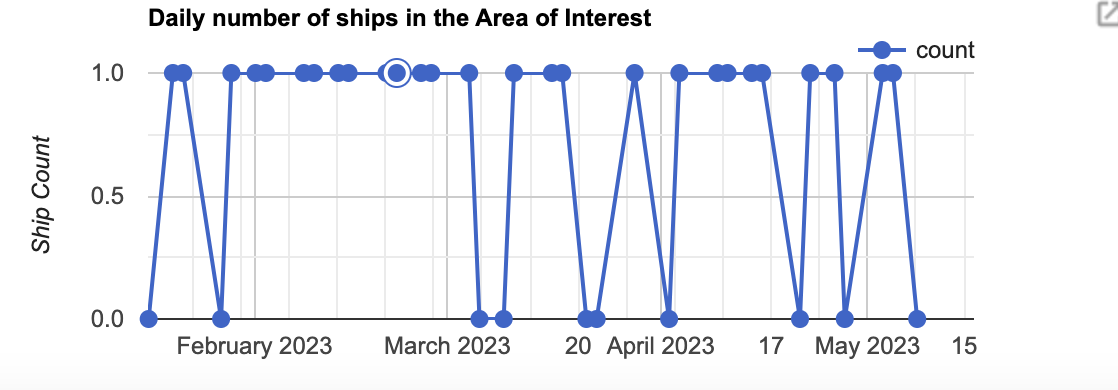
This pattern has been sustained so far in 2023.
3. Set Chart Options
Finally, there are three options that can be used to further refine the search.
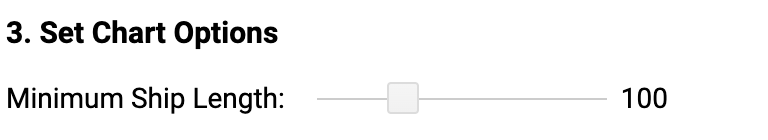
First is a slider indicating the minimum length used for detection. The default is 100m, which is generally the smallest class of many merchant vessels such as bulk carriers or container ships. Length is calculated by fitting a bounding box around the ship detection and measuring the diagonal.
A dropdown menu also allows users to select the chart type, these include:
- Daily Count: the daily number of ships detected in the AOI.
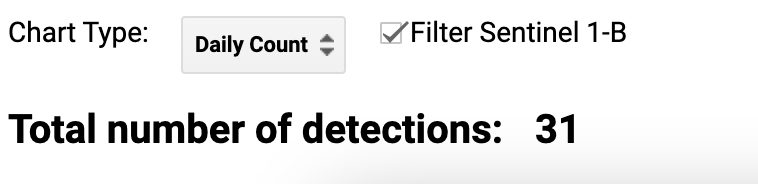
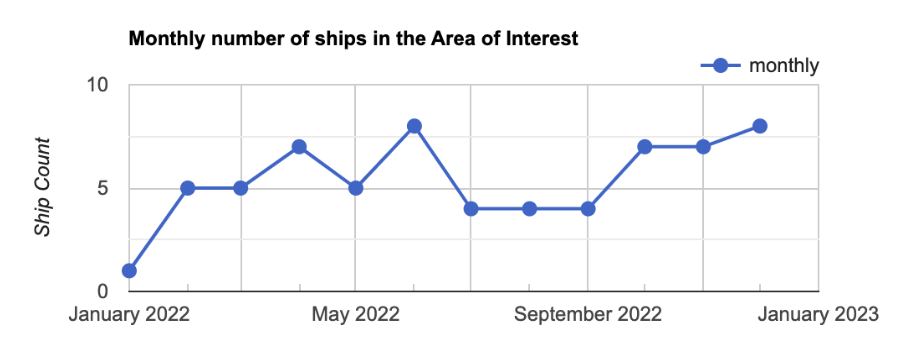
- Monthly Count: the monthly number of ships detected in the AOI.
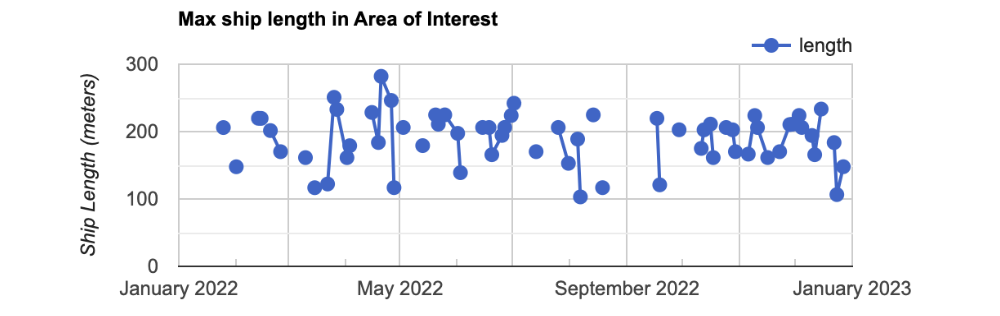
- Ship Length: the maximum length of a ship detected in the AOI.
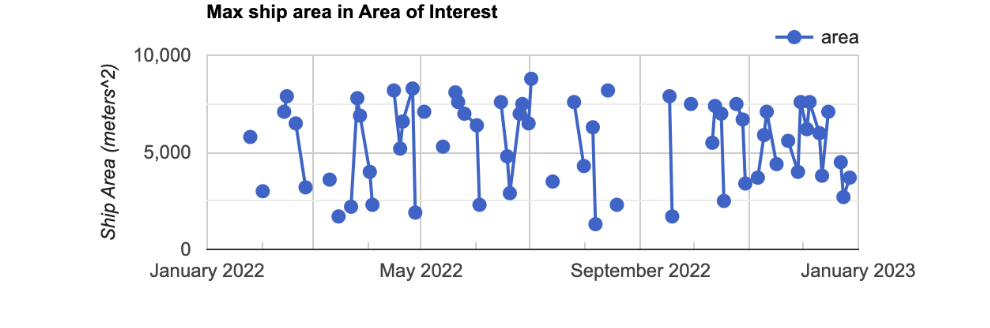
- Ship Area: the maximum area of a ship detected in the AOI.
The bottom two options are most useful for monitoring areas in which a single ship is expected at any given time, such as a berth. This allows users to investigate whether large ships are docking in a given area. The example charts above are from the default AOI at the Avlita terminal.
The third chart option is a checkbox allowing the user to filter out imagery taken by the Sentinel-1B satellite, enabled by default. The Sentinel-1 constellation is composed of two satellites, Sentinel-1A and Sentinel-1B. But the latter has been offline since late December 2021 due to a system failure. As a result, only half as much imagery is available from this point onwards. Unchecking this box will double the number of images (and probably ship detections) prior to 2022, but users must be careful in interpreting changes in the number of ships. It will look like there is a drop in maritime activity, but in reality this is a drop in the amount of available imagery.
How do we Know the Tool Works?
To demonstrate the effectiveness of the tool, we can compare a situation where AIS data is available to one where it is not.
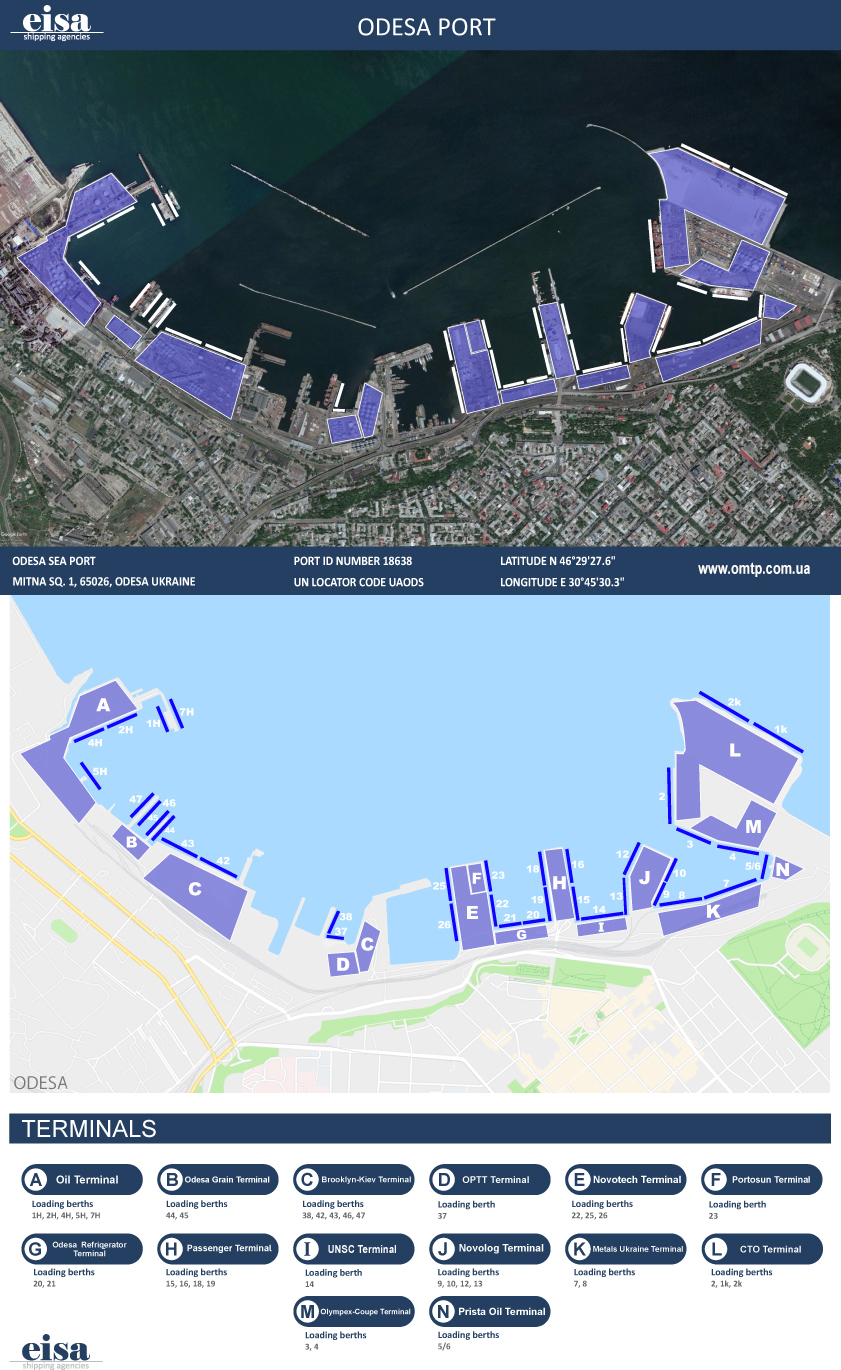
The Port of Odessa on Ukraine’s Black Sea coast (where there is AIS data available) offered the perfect comparison to Sevastopol (where little to no AIS data is available) given it is also a major grain exporting destination.
More than 1.7 million tonnes of grain was processed via the Port of Odessa’s five berths in 2021. The berths at the grain terminal are operated by the Brooklyn-Kyiv company, and are numbered 43 to 47, as seen in the image below.
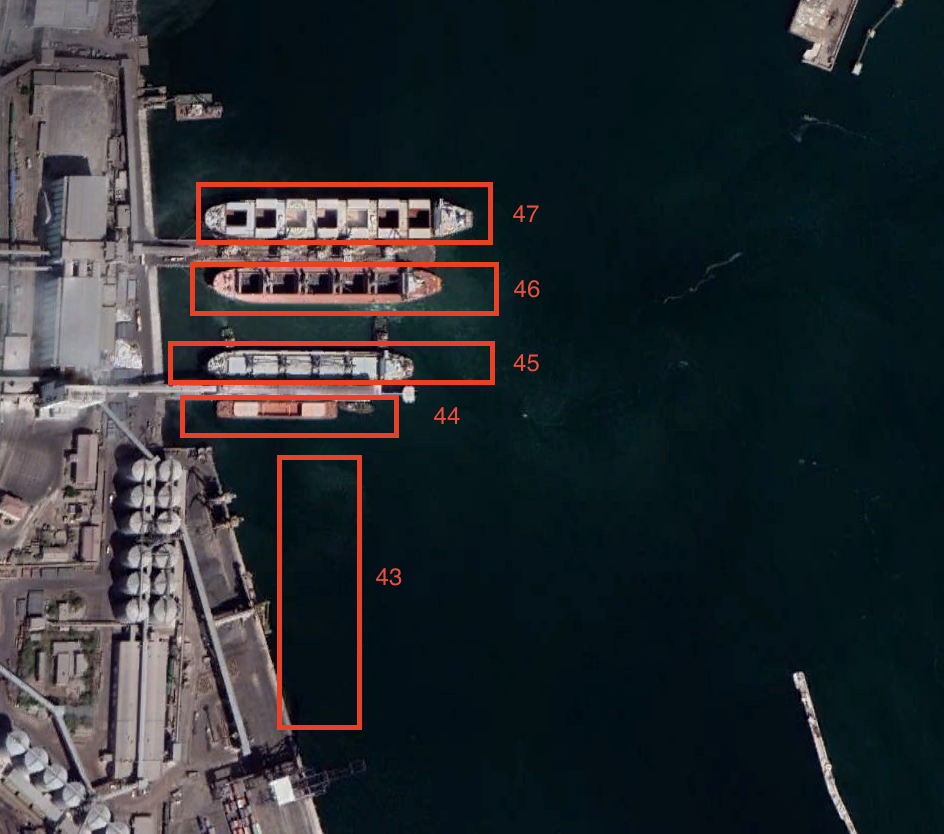
We can draw a box along each one of these berths and download AIS data from a provider such as MarineTraffic or Vessel Finder between 2021 and 2023 to examine how the Ship Detection Tool compares.
These signals must be filtered to only include those broadcast by vessels capable of carrying significant quantities of grain (bulk carries and general cargo ships that are at least 100m in length), so that we’re not picking up on tug boats and other small ships.
For each day, we can check the berths to see if there’s an AIS signal and, if so, whether there is a corresponding SAR image (and vice versa).
Cross-referencing AIS data and satellite detections in this way leads to four scenarios detailed below:
- A ship is detected by both AIS and satellite (happened on 383 occasions)
- No ship is detected by satellite and there is no AIS signal (happened on 1,058 occasions)
- No ship is detected by satellite but there is AIS signal (happened on 108 occasions)
- A ship is detected by satellite but there is no AIS signal (happened on 24 occasions)
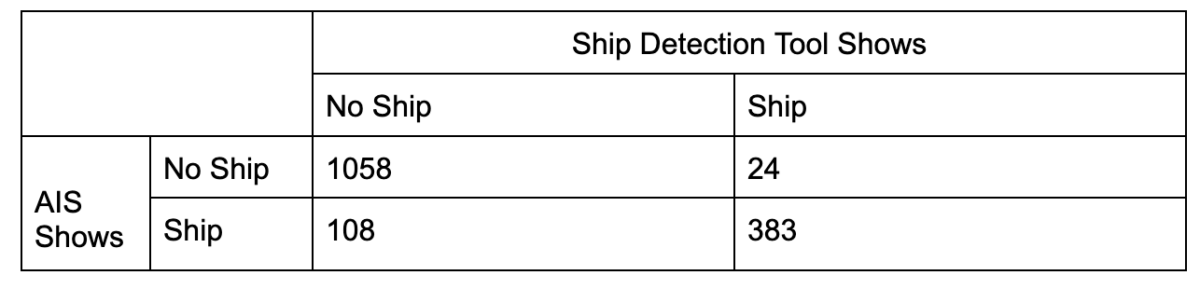
This suggests that the Ship Detection Tool, using SAR imagery, matched up with the AIS data on 1,444 out of 1,576 occasions. That’s an accuracy rate of 91.6%. But it’s important to understand that this doesn’t mean that on the remaining 8.4% (132 occasions) a ship had not been present at the Port of Odessa.
Most of the errors documented (108) were when a ship appeared on AIS data but not on SAR imagery. This can likely be explained by the fact that SAR imagery only captures a snapshot on a given day. For example, if a ship is present at the port in the morning but the Sentinel-1 satellite does not pass and capture an image until the afternoon or evening it’s possible the ship could already have left and therefore won’t appear in SAR data.
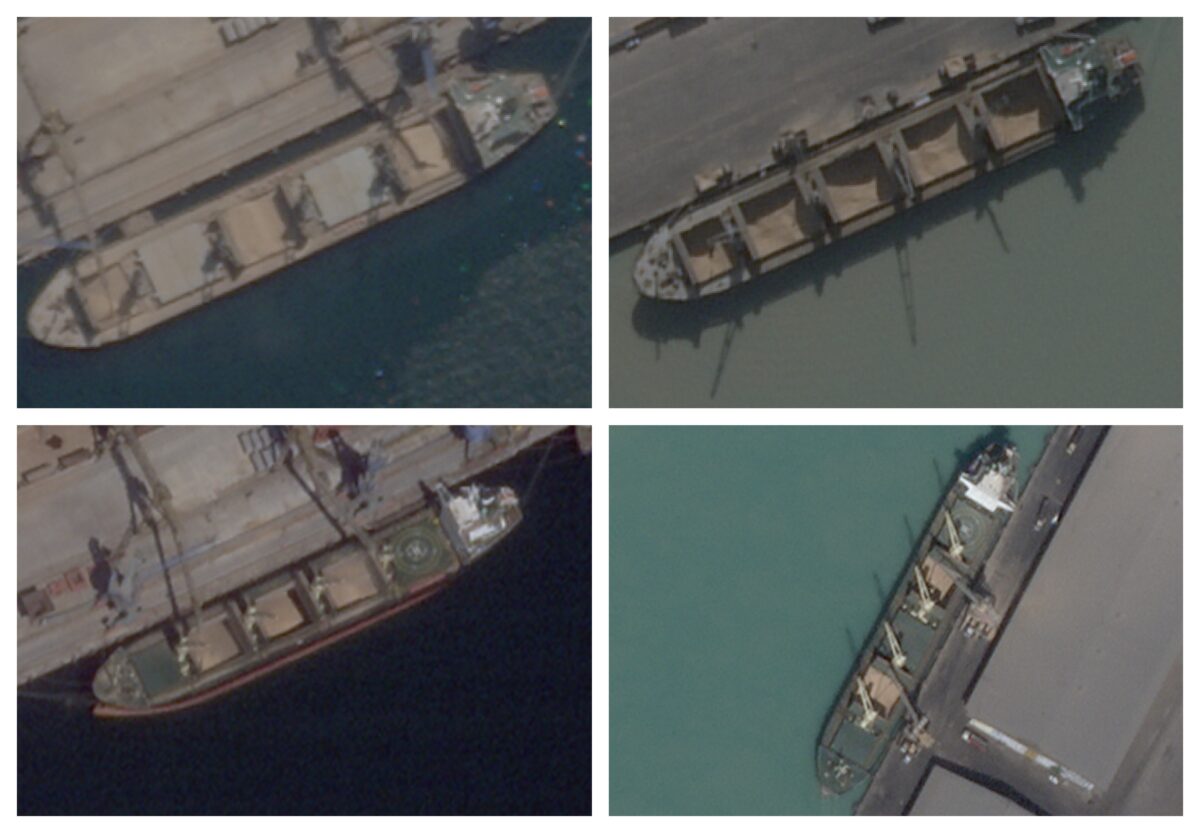
The remaining 24 errors occurred when a ship was detected by SAR imagery but not by AIS data. This could mean that a ship visited the port with its AIS switched off, or that the SDT mistakenly identified another object as a ship. This could be a crane overhanging the water or a tug boat mistaken for a larger vessel. A quick look at the individual SAR images allows us to confirm if this has occurred and then disregard the erroneous capture.
Despite these caveats, comparing the frequency of AIS signatures per month with the number of satellite ship detections per month demonstrates the accuracy of this approach – as shown by how closely the plots below match.
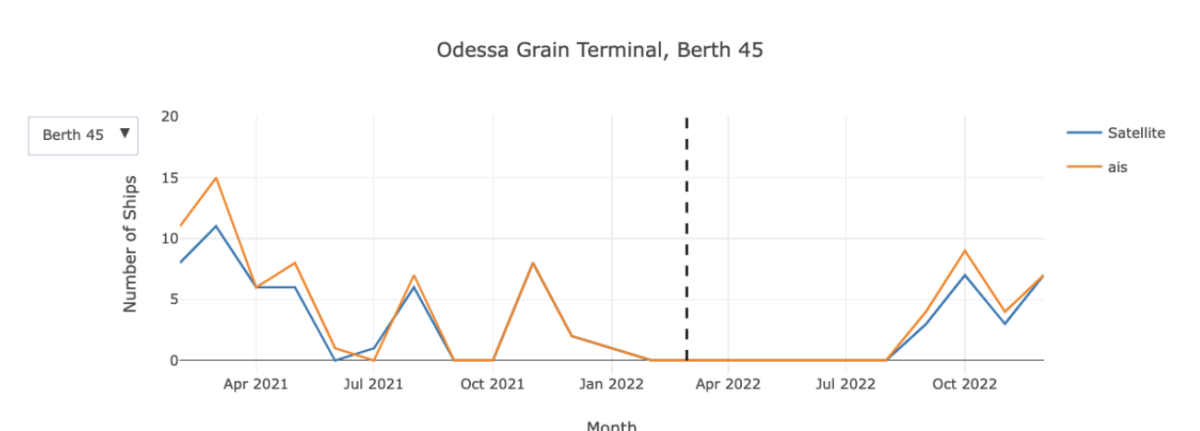
Firstly, the frequency of monthly satellite ship detections and monthly AIS signals are extremely close. But secondly, there is a massive drop in traffic at all berths coinciding with the beginning of the war in Ukraine, followed by a gradual increase in the autumn of 2022 as a deal to export grain from Ukraine was brokered by Turkey.
The tool thus appears remarkably accurate. If anything, it may be the case that any inaccuracy may be in undercounting the number of ships documented by SAR rather than overcounting them given the number of times AIS data captured the presence of ships and the Ship Detection Tool did not.
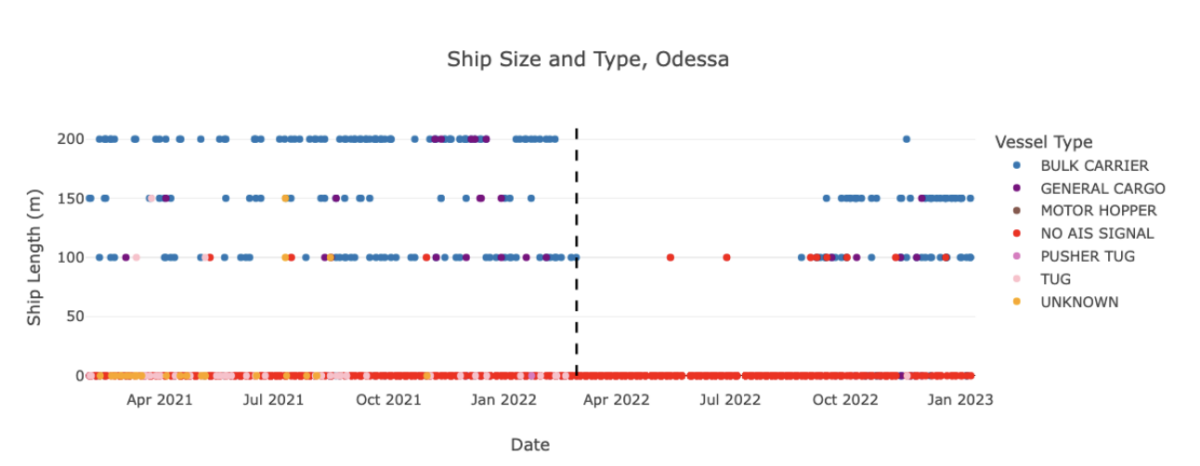
Given the SDT can measure the lengths of objects it records, we can also infer the type of vessels likely to have been present in captured data. As the below plot shows, SDT measurements matched up closely with AIS data broadcasts that detail the type of ship being recorded.
Comparing to Sevastopol
Now that we’ve established what “normal” marine traffic at another grain terminal looks like, it’s time to take a closer look at the Avlita terminal in Sevastopol.
Below is the same type of plot, cross referencing ships detected by AIS and by Satellite/SAR Imagery, except this time in Sevastopol. However, it is important to note that this analysis was carried out for the period between April 2021 and October 2022, so the numbers here differ from Bellingcat’s investigation into ship movements in Sevastopol since the start of the war in Ukraine:
- A ship is detected by both AIS and Satellite (happened on three occasions)
- No ship is detected by satellite ship and there is no AIS signal (happened on 137 occasions)
- No ship is detected by satellite but there is AIS signal (happened on five occasions)
- A ship detected by satellite but there is no AIS signal (happened on 86 occasions)
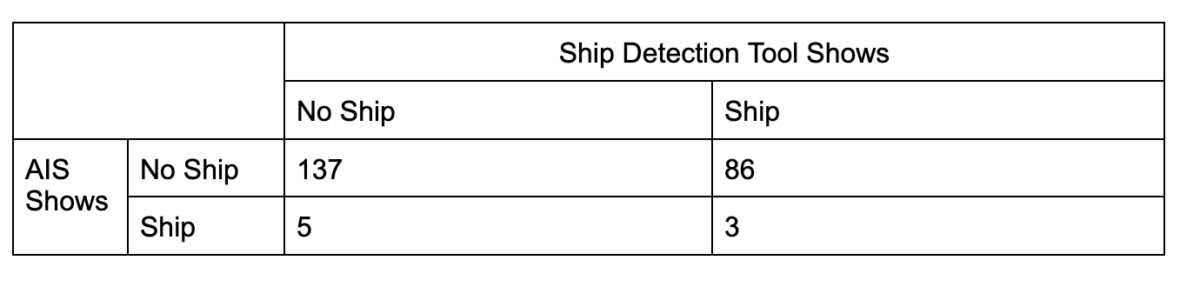
Of the 89 ships detectable by SAR imagery at the Avlita terminal, only three had a corresponding AIS signal. In Odessa, 94% of ships detected by the Satellite Detection Tool had an AIS signal.
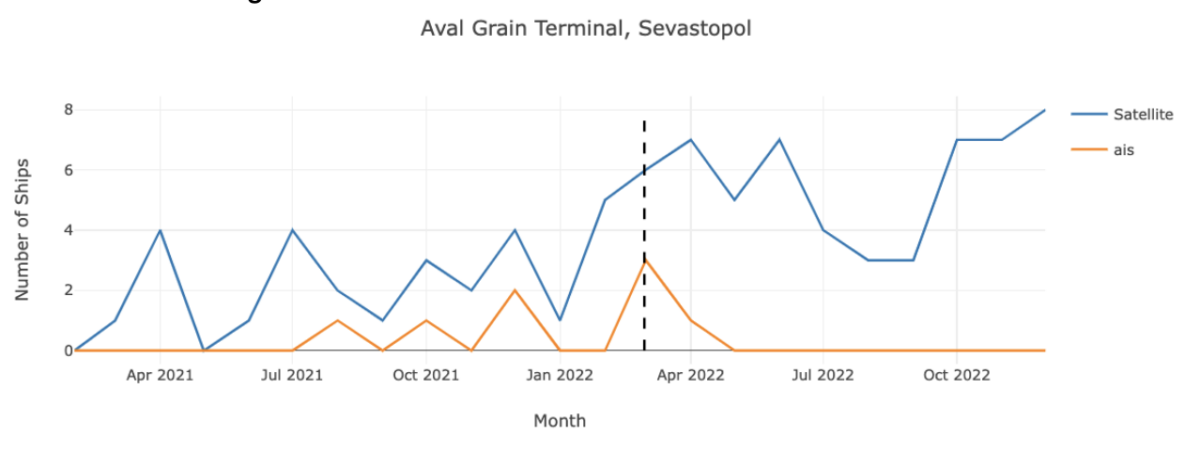
While marine traffic in Odessa dropped to zero immediately after the Russian invasion, the number of ships detected by satellite increased in Sevastopol even though there were no AIS signals after March 2022.
This means one of two things; either the ship detection tool is incorrect, or ships have been arriving at the Avlita terminal with their AIS transponders switched off.
Luckily optical satellite imagery confirms that ships have regularly been docking at the terminal. We can therefore be safe in our conclusions that the Ship Detection Tool is correctly picking up marine traffic.
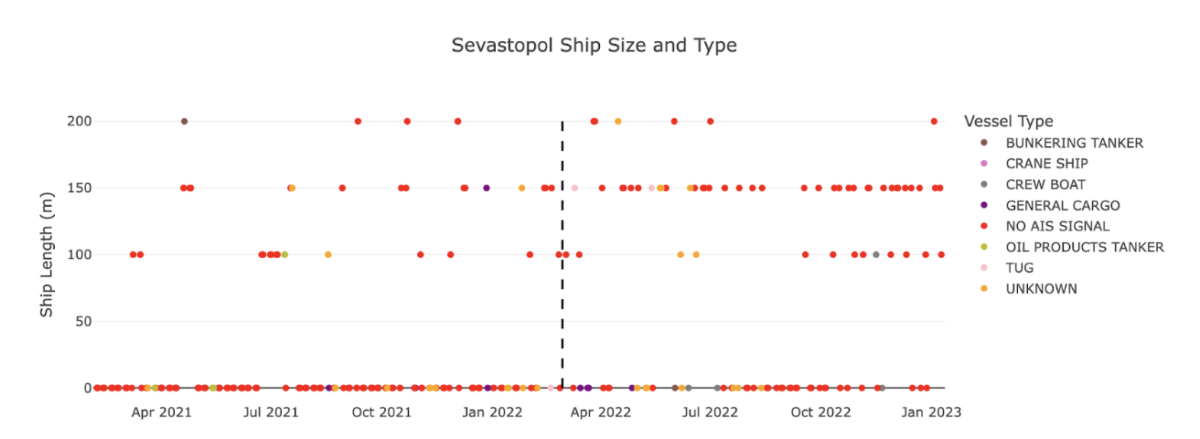
As with Odessa, the SDT can estimate the size and type of ship docking at the Sevastopol terminal. Most appear to be in the range of 150m, which would put them in the Handysize or Handymax range of bulk carriers.
Other Uses for the Ship Detection Tool
The SDT can also prove useful in picking out static ships in anchorage areas before they go into ports.
This was used in Sevastopol to document dozens of ships that had their AIS transponders turned off, waiting to enter the port.
Going further back in time, another scenario where the tool captured an interesting snapshot was when the Ever Given cargo ship blocked the Suez Canal back in March 2021.
With an AOI drawn around the anchorage of Port Said, near the mouth of the canal, a huge spike was detected as vessels waited for the blockage to be cleared.

Clicking on the peak of the spike on 30 March 2021 shows that there were 76 ships larger than 200m stuck in the anchorage on that day alone.
We can also see (at the bottom of the left panel) that 2,714 ships were captured passing through this AOI in 2021.
Going back to the conflict in Ukraine, another potential area where the SDT could prove useful is identifying potential ship-to-ship grain transfers.
This is an issue that has been highlighted in reporting by Bloomberg News and the Wall Street Journal (WSJ). It sees Russian vessels take grain from sanctioned ports before meeting vessels that have embarked from other ports in Russia. The ships that have departed from sanctioned ports then transfer their grain to the other vessels, thus disguising the true origin of the products.
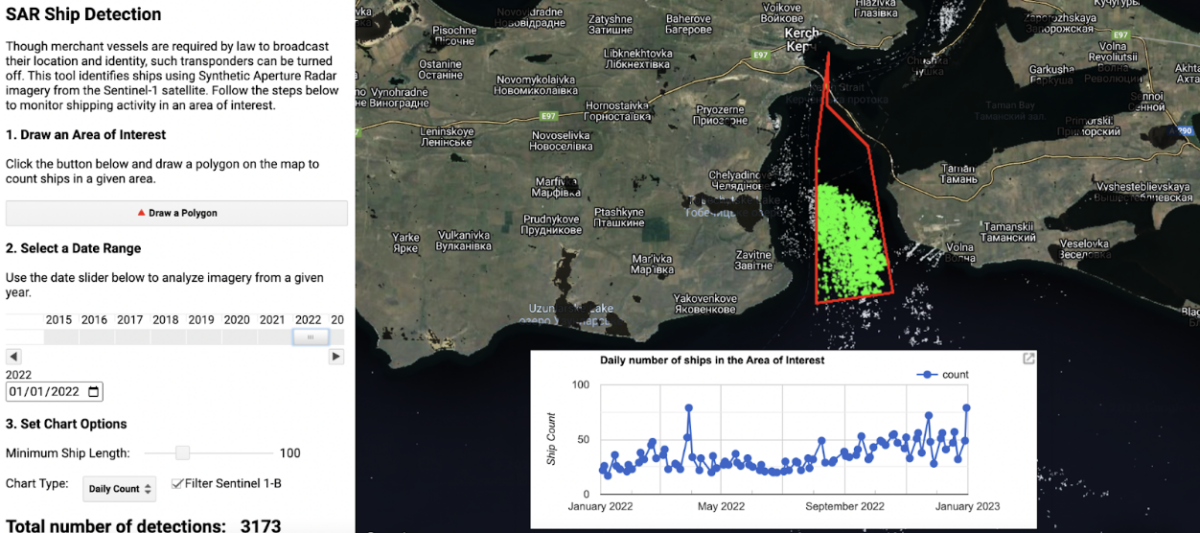
Bloomberg News, the WSJ and others have reported that such transfers have taken place in the Kerch Strait and closer analysis of this area between Russia and Crimea could provide more leads for investigation. As the image below shows, this is an area with a lot of ship traffic and thus plenty more to investigate.
Other uses for the SDT include monitoring marine traffic in protected areas or ship movements at other sanctioned ports around the world.
Readers are encouraged to test the tool and send any feedback on improvements or modifications here.
Bellingcat is a non-profit and the ability to carry out our work is dependent on the kind support of individual donors. If you would like to support our work, you can do so here. You can also subscribe to our Patreon channel here. Subscribe to our Newsletter and follow us on Twitter here and Mastodon here.
